Review and analyze your data
12:22 minutes total learning time
Explore how to use the Phocas Grid to easily review and analyze your data. Learn to drill down from high-level summaries to detailed transactions and view your data from various angles, such as by customer, branch, product, or region.
Phocas product
6 videos in this onboarding module
1
Compare data with matrix mode
1:46
2
Select and change periods
2:23
3
Change the mode
1:23
4
Add levels to the grid (nesting)
1:59
5
Perform an advanced search
3:32
6
Phocas AI
1:19
6 videos in this onboarding module
1
Compare data with matrix mode
1:46
2
Select and change periods
2:23
3
Change the mode
1:23
4
Add levels to the grid (nesting)
1:59
5
Perform an advanced search
3:32
6
Phocas AI
1:19
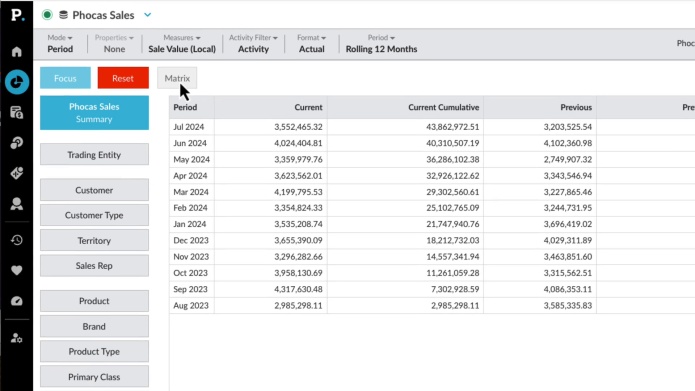
Compare data with matrix mode
Discover how to use a simple matrix tool to compare sales performance across regions, branches, or products side-by-side, and identify opportunities for cross-selling within your customer base.
Supporting documentation
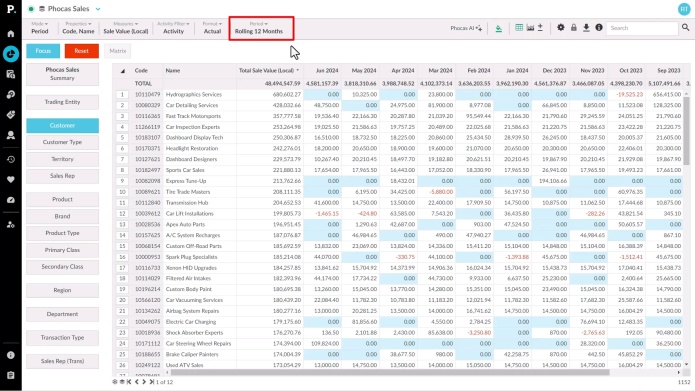
Select and change periods
Learn about using periods (date ranges) in Phocas. In this video Tina shows you how to choose a pre-defined period, apply a custom period or add a defined period for your own use.
Supporting documentation
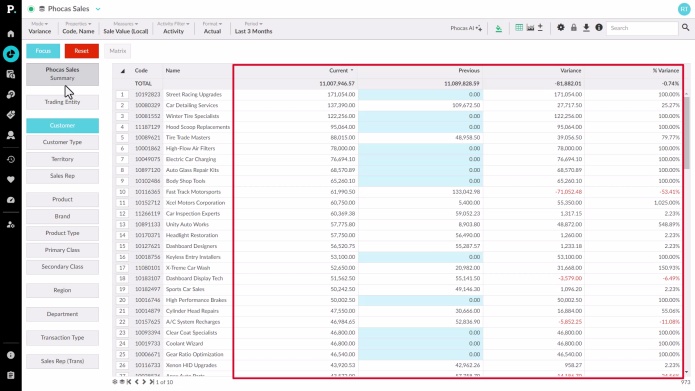
Change the mode
Learn how to switch modes to change the way your data is shown in the grid.
Supporting documentation
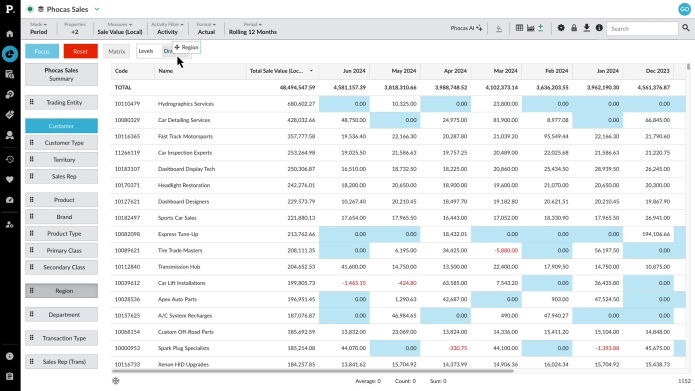
Add levels to the grid (nesting)
Learn how to bring together related data from different dimensions as an expandable report in the Phocas grid using the 'nest' feature. Grid nesting allows you to display up to three levels of detail, grouped by dimension.
Supporting documentation
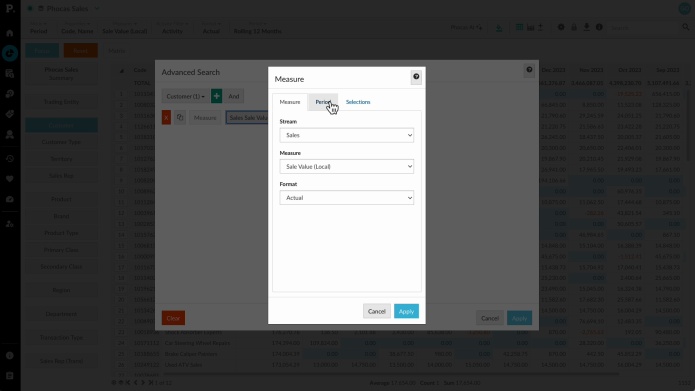
Perform an advanced search
Advanced search helps users build detailed reports by applying specific filters to narrow down data. Users can set multiple rules and combine them with conditions like AND or OR to customize and refine their search results. This feature is ideal for creating precise reports or favorites based on specific criteria.
Supporting documentation
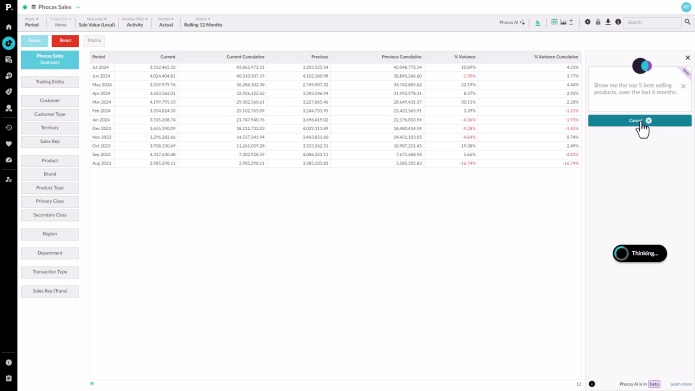
Phocas AI
Phocas AI makes it easy to get quick answers and insights by letting you ask questions that relate to your business databases. This is especially useful for new or occasional users who might not be familiar with all the features. You can ask questions in your own words and see the steps taken to get the results, helping you learn along the way.
Supporting documentation
Phocas product

Related onboarding modules
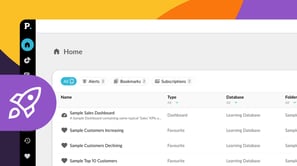
Discover Phocas Analytics
This beginner module helps you get started with Phocas Analytics. You’ll learn how to navigate the homepage and grid, plus how to do some simple analysis to quickly get insights from your data. The videos will introduce you to features you’ll use every day.
4 videos
8:27 min
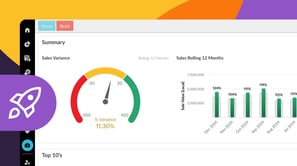
Report on your data
Learn how to export data, save favorites, set up alerts, and create visual overviews with tools like dashboards, charts, and graphs. These features make it easy to present your metrics clearly and effectively.
4 videos
9:37 min