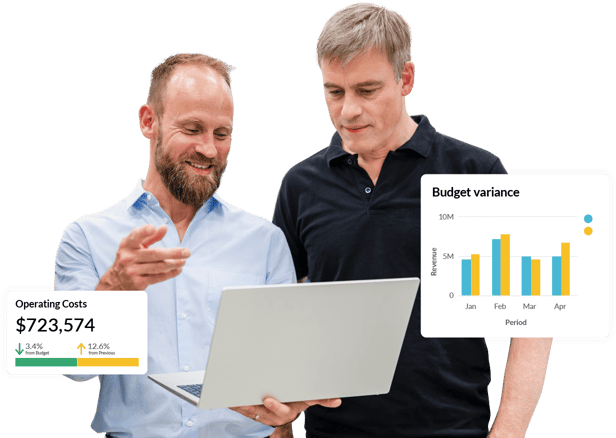
Faster insights, smarter planning
Amanda Ware from Stokes Electric explains how Phocas replaced clunky ERP reports and manual spreadsheets with automated, drillable financials – saving time, boosting accuracy and helping her team plan better across finance, sales and inventory.

See the big financial picture
FP&A teams often works from a single ERP or static Excel spreadsheets, while other departments use separate systems. This creates blind spots, slows decision-making and makes cross-functional planning difficult. With Phocas' combined BI and FP&A platform, accurate, centralized data becomes the core foundation of your planning processes.
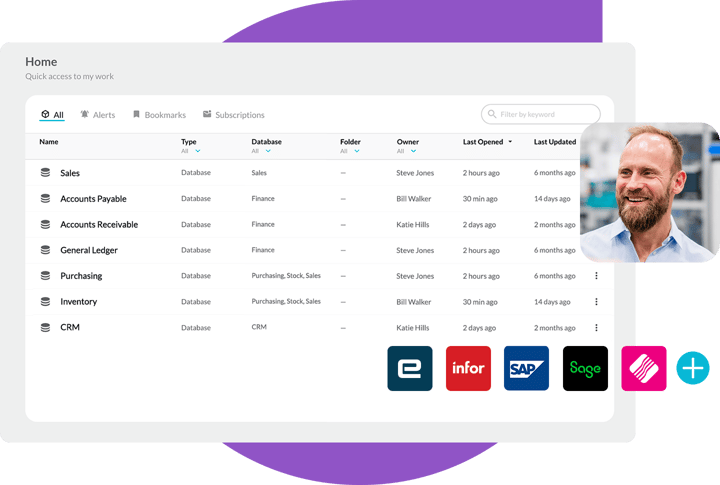
- Automated: Data is pulled from your ERP + any other source (CRM, sales, inventory, AR/AP, purchasing, multiple spreadsheets) into a single source of truth.
- Centralized access: All teams can quickly access accurate, consolidated data from one user-friendly environment while finance maintains employee-level security.
- Reliable: Handles big data volumes while maintaining fast performance – no lag time.
- AI-assisted functionality: Accelerate analysis by asking questions like, 'Which customers declined last quarter?' and get instant answers.
Customer quote
"The analysis we do now is incredibly comprehensive, allowing us to understand the root causes of variances and performance issues accurately. When we spot a trend, we action it immediately."
Custom reporting, self-serve analysis
Many FP&A tools only allow one rigid path to invoice-level data. Phocas makes financial reporting fast, dynamic and tailored to your business.
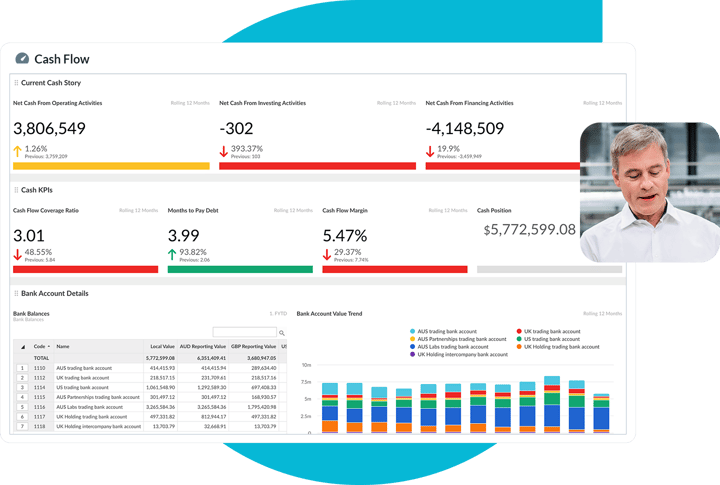
- Fast: Create, customize, automate profit & loss, balance sheet and cashflow statements for cross-functional teams in minutes.
- Split: Quickly split reports like profit & loss to compare divisions, subsidiaries, regions, cost centers.
- Data visualization: Drill down to transaction-level detail and pivot data through multiple layers; branch, division, sales rep, customer, product.
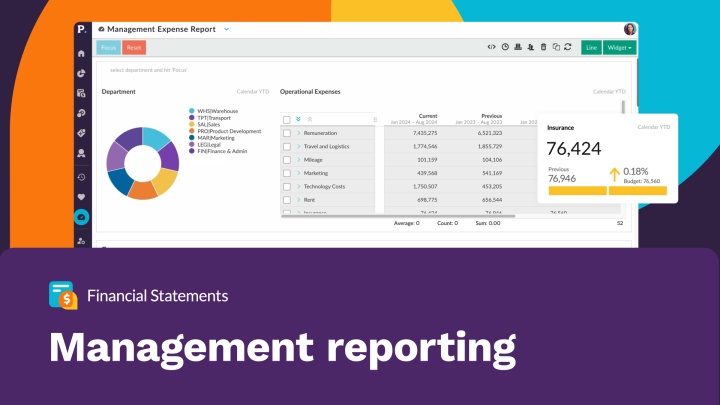
- Management reporting: Customized exec dashboards enable department heads to access up-to-date metrics specific to their division.
Whiting Holdings halves financial reporting time
"Phocas created a lot of efficiencies in our finance team, we reduced the number of days to roll out reports from 10 to 5. It allows us to report and dashboard KPIs within our organization, and also make decisions easily by getting to the source of the data quickly."
Ingrid Vanlangenberg, Finance Project Manager - Whiting Holdings

Management & board-ready reports
Fast, adaptive planning
Most FP&A solutions can’t keep up – they’re rigid, siloed and slow to adapt when financial plans change. Phocas makes it easy to plan across teams, align on accurate budgets and reforecast fast using real-time data – so you can respond with confidence when conditions shift.
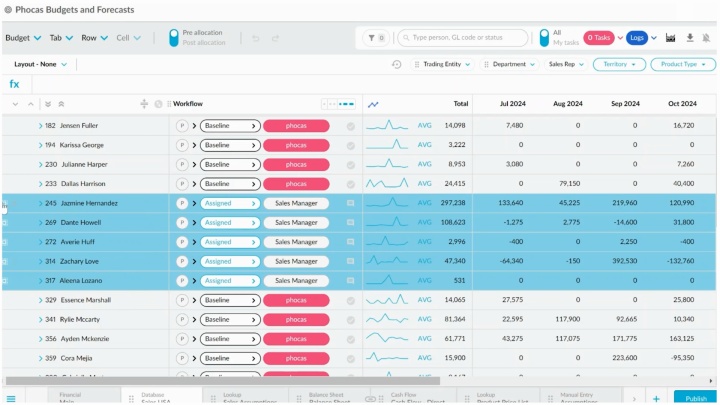
- Flexible: With a familiar, speadsheet-like interface, it's easy to make your budgets more detailed – without manual errors or version control issues.
- Automated: Live ERP data flows into budgets and forecasts automatically, so actuals are always up to date and reliable.
- Collaborative: Assign tasks, track approvals and get faster buy-in with clear, secure visibility for all stakeholders.
- Connected: Link plans across the business, from financial budgets to sales forecasts, headcount and demand planning – all in one shared, accessible planning platform.
Types of FP&A planning
Financial planning and analysis isn’t one-size-fits-all. Depending on where you are in your business cycle, your finance team might be focused on setting strategic direction, aligning performance targets, or meeting compliance needs. Phocas gives you one place to manage all types of FP&A planning approaches.
Goal
- Long-range planning
Sets the strategic direction for the next 3-5 years - Target setting
Turns strategy into measurable, trackable goals across teams - Forecasting
Predicts future revenue, costs and cash flow to reduce risk - Annual budgeting
Translates strategy into a financial plan for the year ahead - External guidance
Communicates performance to stakeholders like boards and investors
How Phocas actions this
- Long-range planning
Aligns financial and operational data for top-down strategic planning, goal tracking and scenario modelling - Target setting
Build custom KPI dashboards, track live progress daily and align business units on shared performance metrics - Forecasting
Uses live data and driver-based modelling to create rolling forecasts that adjust as conditions change - Annual budgeting
Automated budgets with real-time data from your ERP + other sources, helps teams collaborate, stay accountable and adapt - External guidance
Centralizes financial results and reporting for consistent, compliant performance updates everyone trusts
| FP&A types | Goal | How Phocas actions this |
|---|---|---|
| Long-range planning | Sets the strategic direction for the next 3-5 years | Aligns financial and operational data for top-down strategic planning, goal tracking and scenario modelling |
| Target setting | Turns strategy into measurable, trackable goals across teams | Build custom KPI dashboards, track live progress daily and align business units on shared performance metrics |
| Forecasting | Predicts future revenue, costs and cash flow to reduce risk | Uses live data and driver-based modelling to create rolling forecasts that adjust as conditions change |
| Annual budgeting | Translates strategy into a financial plan for the year ahead | Automated budgets with real-time data from your ERP + other sources, helps teams collaborate, stay accountable and adapt |
| External guidance | Communicates performance to stakeholders like boards and investors | Centralizes financial results and reporting for consistent, compliant performance updates everyone trusts |
| Talk to an expert |
Customer quote
"The advantages of combining sales data budgets onto the GL is a game-changer. It removes complex spreadsheets and coupled with workflow and approval processes, ensures the business is only a click away from seeing the current status of budgets or forecasts."
Improve business performance
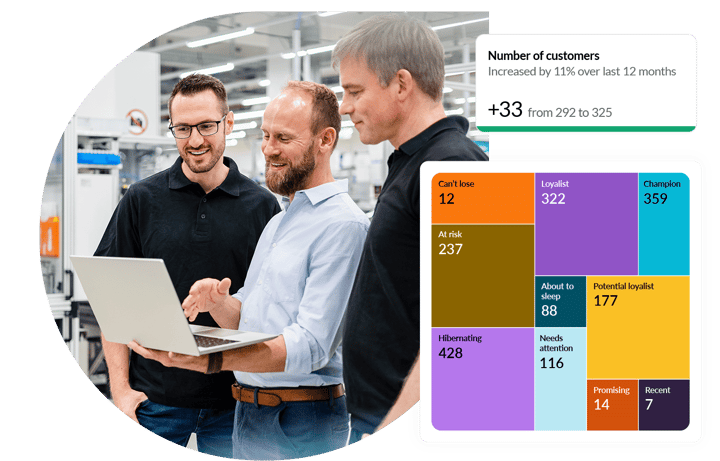
- See what's driving results: Explore live data to understand why sales dipped, costs jumped or targets were missed – share actionable insights across departments.
- Proactive, not reactive: Spot risks or unexpected expenses early, so you can act fast and keep things on track.
- Plan and reforecast with ease: Build rolling forecasts and adjust plans quickly as things change, without battling spreadsheets.
- Bring clarity: Help more people understand the numbers, align on goals and make smarter data-driven decisions.
Take a Phocas product tour
-
 Analytics
 -
 Financial Statements
 -
 Budgets & Forecasts
 -
 Platform
Built to scale as you grow
Phocas FP&A tools are scalable and designed to handle complexity – so your team doesn't have to. Whether you’re managing more data, adding users, or expanding through acquisition, the platform grows with you, without the stress or extra manual admin.
- Multi-entity ready: Report, plan and forecast across divisions, currencies and ERPs with one unified view. No manual merges, no confusion – just clarity.
- Performance at any scale: Whether you're a small, mid or large enterprise company, Phocas maintains fast performance and data integrity – even as volumes grow or structures change.
- Seamless integration: Pre-built connectors and flexible APIs integrate easily with your ERP and other data sources – no heavy IT lift or custom coding needed.
- Proven during change: From rapid growth to ERP migrations, Phocas helps teams stay aligned, keep reporting consistent and avoid disruption.
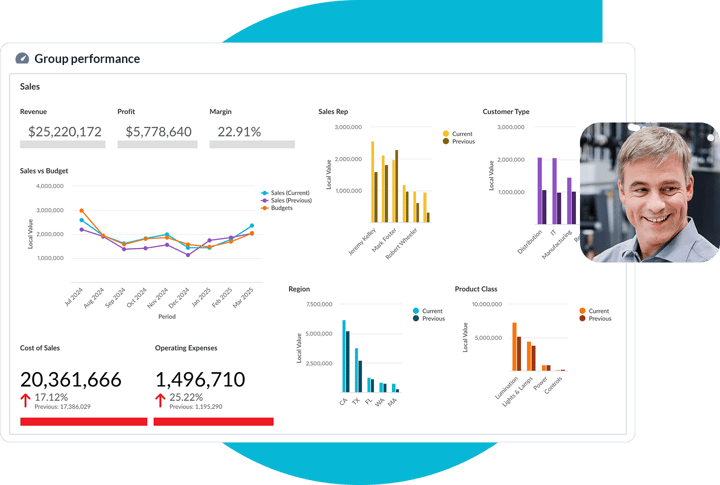
Scaling with Phocas across 90 sites
Managing a $750m business with 90 locations requires deep daily insights, which is why 100s of users at Headwater Companies rely on Phocas and refer to it as a "core necessity".
Secure planning you can count on
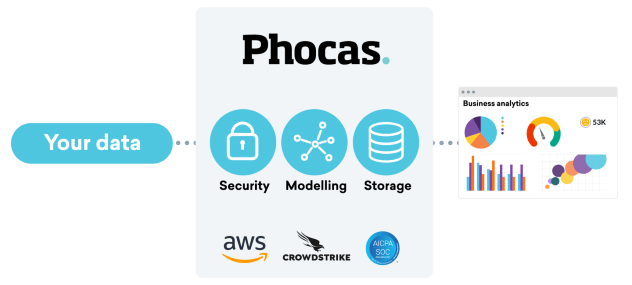
When it comes to financial planning and analysis, accuracy and trust are everything. Phocas FP&A tools are built on a secure foundation, so you can plan, forecast and report with confidence – knowing your most critical business data is always protected and up to date.
- Granular control: Role-based permissions let teams work from the same numbers while protecting sensitive information.
- Trusted platform: Built on enterprise-grade architecture and hosted on AWS, Phocas provides a secure environment for all your data.
- Global standards: SOC 2 Type 2 and GDPR-compliant, helping you stay audit-ready and meet evolving regulatory requirements.
- Connected data, protected everywhere: From ERP to CRM to spreadsheets, all data sources flow into one secure platform, giving you a consolidated, real-time view with full governance.
Financial close: from one week to one day


— Nathan Bluett, Chief Executive at Islands Petroleum.
See how Phocas stacks up against the competition
Anaplan vs Phocas


Board vs Phocas


Jedox vs Phocas


OneStream vs Phocas


Prophix vs Phocas


Vena vs Phocas


Choosing the right software
The "best" software choice is the one your team will actually use. Here are top tips from our buyer's guide:
- Does the software connect directly to your ERP?
- Is it easy for non-finance people to use?
- Can it handle your specific needs; multi-company budgets, headcount planning?
- Does the vendor understand your industry; manufacturing, distribution, retail?

Frequently asked questions
FP&A software stands for Financial Planning & Analysis software. It's a specialized tool designed to aid businesses in their financial forecasting, budgeting, and overall strategic planning. This type of software helps finance professionals analyze operational data, predict future performance, and make informed decisions that align with the company's financial goals. It's a critical component for businesses looking to streamline their financial operations and gain deeper insights into their fiscal health.
Leading FP&A tools are, Anaplan, Workday, Vena and Prophix - and of course Phocas (we had to say it). Phocas’s FP&A software is unique because of its seamless integration with ERPs and other data sources, as well as being one of the easiest platforms to use for forecasting and budgeting.
- Budget Models
- Forecasting Models
- What-if Analysis
- Management Reportings
- Consolidation Models
- Cost Optimization
- Capital Planning
Key metrics a FP&A dashboard should track include:
- Financial Metrics - KPIs like revenue, gross margin, operating costs, EBITDA, net income to track profitability and cost efficiency.
- Operational Drivers - Leading indicators like sales pipeline, production capacity, inventory turns that impact financials.
- Growth Rates - Trends in customer acquisition, revenue growth, market share to monitor expansion.
- Budget vs. Actuals - Charts showing variance analysis between budgeted costs and revenues vs actual performance.
- Forecast vs. Actuals - Graphs overlaying latest financial forecasts on top of real-time rolling actual results.
- Cash Flow - Measures for cash balance, cash cycle, cash flow from operations to assess liquidity.
- Model Outputs - Summary outputs from FP&A models like driver-based budgets, what-if scenarios, long-range forecasts.
Understand the past, operate better today, and plan well for the future


