Report on your data
9:37 minutes total learning time
Learn how to export data, save favorites, set up alerts, and create visual overviews with tools like dashboards, charts, and graphs. These features make it easy to present your metrics clearly and effectively.
Phocas product
4 videos in this onboarding module
1
Save useful data as a favorite
2:53
2
Create a 'low margin' alert
3:31
3
Visualize your data in a chart
1:22
4
Discover dashboards
1:51
4 videos in this onboarding module
1
Save useful data as a favorite
2:53
2
Create a 'low margin' alert
3:31
3
Visualize your data in a chart
1:22
4
Discover dashboards
1:51
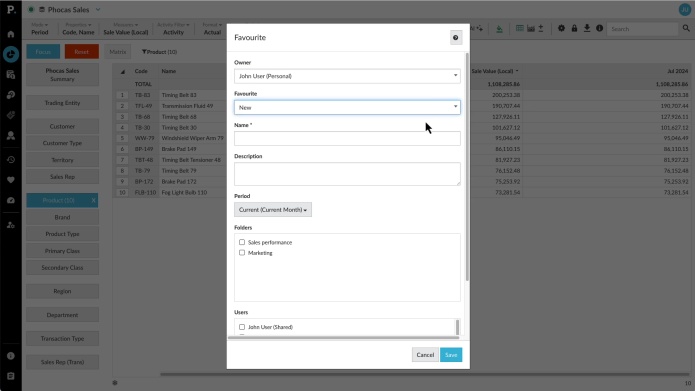
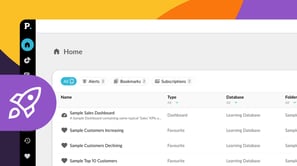
Save useful data as a favorite
Do you often use a specific data view? Learn how to save it as a favorite in Phocas for quick access, where to find your saved favorites, and how to update them when needed.
Supporting documentation
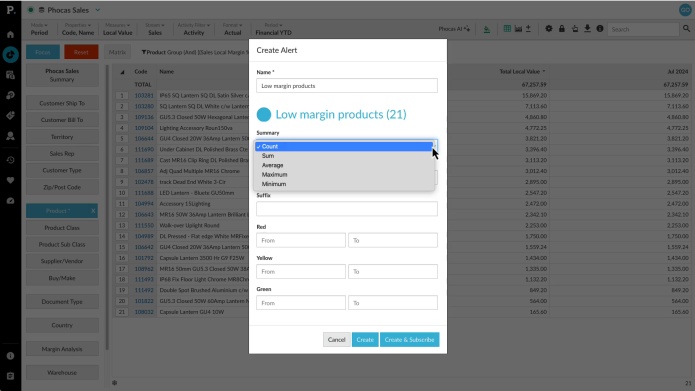
Create a 'low margin' alert
In this video, learn how to build a low margin report using advanced search - and then create a color-coded alert for your dashboard or home page.
Supporting documentation
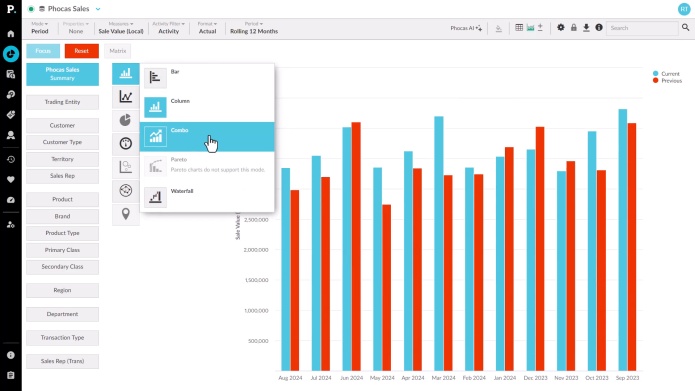
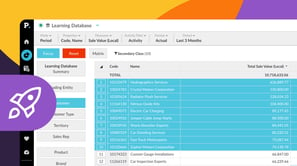
Visualize your data in a chart
Discover how you can use charts to quickly visualize your data and spot trends at a glance. Charts are especially helpful when dealing with large datasets, allowing you to get an easy visual overview without scrolling through endless columns and rows in the grid.
Supporting documentation
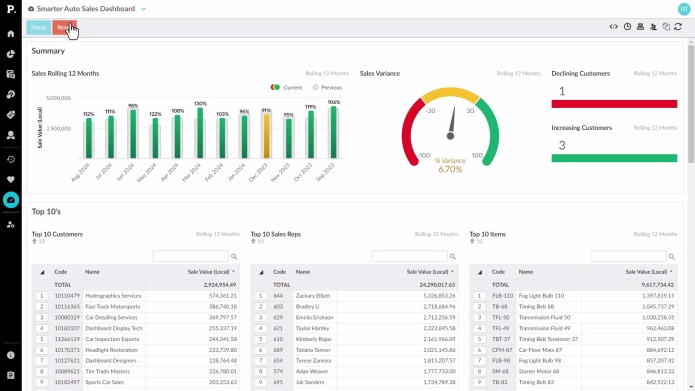
Discover dashboards
See just how user friendly a Phocas dashboard can be. Here we show you how to make some simple selections on a dashboard, focus, clear and reset.
Supporting documentation
Phocas product

Related onboarding modules
Discover Phocas Analytics
This beginner module helps you get started with Phocas Analytics. You’ll learn how to navigate the homepage and grid, plus how to do some simple analysis to quickly get insights from your data. The videos will introduce you to features you’ll use every day.
4 videos
8:27 min
Review and analyze your data
Explore how to use the Phocas Grid to easily review and analyze your data. Learn to drill down from high-level summaries to detailed transactions and view your data from various angles, such as by customer, branch, product, or region.
6 videos
12:22 min