Custom Sage financial reporting and dashboards
Quick, obligation free

Quickly see the automated reporting options with Phocas + Sage - 1:17s
Made for Sage
- Sage 50
- Sage 100 CRE
- Sage 100 Contractor
- Sage 200
- Sage 300 CRE
- Sage Intacct
- Sage X3
All your data in one place
No more exporting data from your Sage ERP and other sources into Excel spreadsheets to find the answers you need. Phocas delivers real-time insights and customizable dashboards all in one platform.
- Consolidates Sage ERP, CRM, HRIS, inventory data for quick access and use by many people
- Secure data warehousing is all included
- Robust system maps the data for ongoing updates and validation of actuals
- Handles vast amounts of data while maintaining fast and reliable performance.

Custom Sage financial statements
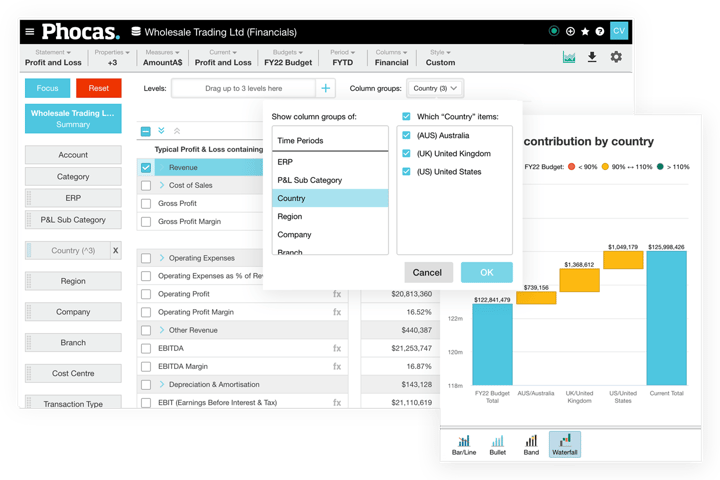
- Effortlessly customize financial statements or flash reports without complex SQL or continuously outsourcing changes at additional costs
- Include various reporting levels; multi entity, branch, country, cost centres
- Create and save custom filters such as product, customer or currency - apply them to reports to make then more targeted
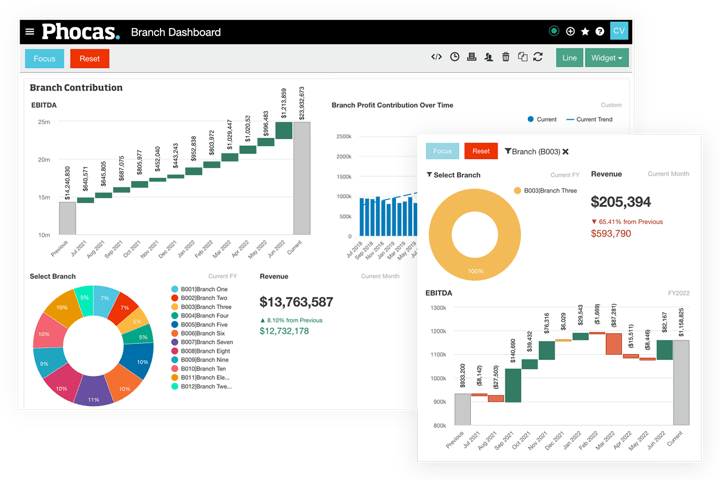
- Add KPI visualizations such as EBITA, margins and ratios that update automatically.

Empower everyone to do more
"It’s very rewarding to be able to give staff and teams access to data that they can understand and drill themselves."
Tim Barr, Head of Finance - Woodberry

Self-service financial analysis
Not only does Phocas transform your financial workflows and efficiency– it changes your business culture helping everyone with clearer decision-making.
- Critical financial data sits in an intuitive data analytics environment, making it easier to analyze
- All your stakeholders, from the CFO to line managers can drill into data and find instant answers
- Gain full visibility of your general ledger and cashflow, streamline inventory management, and analyze sales and revenue data to identify trends and growth opportunities
- Analyze budget vs actual, period against period or division vs division in dashboards.

Customer quote
"We started out needing some better financials – a little cleaner, a little more information... One of the great features with the financials is that I can drill right down into transaction level, which is fantastic because it really helps me find those outliers a lot easier. It really does save a lot of time. So, a few minutes instead of a couple of hours."
See how Phocas stacks up against the competition
Anaplan vs Phocas


Jedox vs Phocas


Insight software IDL vs Phocas


OneStream vs Phocas


Customer quote
Scale with FP&A + BI together
- Phocas offers BI Analytics, Financial Statements, Budgets & Forecasts and Rebates products that integrate seamlessly with Sage ERP systems
- No need to purchase all platform products together, simply choose what you need now and add more when you need them.

Phocas powers thousands of data-driven companies worldwide
 Henry Schein
 Bunzl Industrial Safety
 Thermo Fisher Scientific Australia
 Husqvarna Construction Products
 Johnstone Supply
 Stark Group
 Gazman
 WD-40
WD-40 Hoyts
Hoyts- Monument Tools

- Becker Electric Supply

 Steiner Electric
 Guest Supply Sysco
 Seasol
 Sistema
 KYB
KYB Triton
 TJM Australia
 Nassco
 Baylis & Harding
 Morelli Group
 DMK
DMK Flournoy
Fast implementation, full support
Frequently asked questions
Sage accounting software allows you to create financial reports seperate from your general ledger using an interactive custom report writer :
- Essential reports: profit & loss, balance sheet, trial balance
- Detailed financial metrics
- Cash flow reports
Depending on the Sage ERP you are using, formatting and exporting a financial report might take quite a bit of time each time you adjust a parameter and edit a report. Also, you may be spending too much of your time converting exports into excel-based dashboards or managing permissions and access to sensitive financial data.
That’s where Phocas can step in to improve you Sage financial reporting. Phocas seamlessly integrates with Sage accounting software to allow on-demand reporting and dashboards for more members of your team, from sales to operations, allowing them to make more informed decisions.
When you have business drivers built into your busgets and forecasts, it’s easier to update financial reports based on pricing fluctuations or bigger strategic decisions.
Phocas is a business intelligence and financial planning and analytics platform while Sage ERP systems are designed to manage various aspects of business operations. When integrated, Phocas enables companies to manage their operations more effectively in a various ways, such as:
- Powerful business intelligence analytics - Phocas collects and consolidates huge amounts of data from multiple business sources, empowering Sage ERP users with fast, easy access to real-time data within one platform source.
- Custom reporting - Reports and dashboards are customizable to meet specific business needs and can be created by all users. Insights and metrics that may not be readily available in standard Sage ERP reporting tools can be extracted with ease. Design your own reports that offer a deeper understanding of business performance.
- In-depth analytics - a unique ad hoc analysis layer, The Grid, enables all users to perform in-depth analysis. Drill down to transactional level and pivot the data in multiple ways such as by customer, branch, product or region. Novice users can also take advantage of Phocas AI.
- High performance - By integrating your Sage ERP with Phocas, you'll achieve lightening fast loading times, regardless of the volume of transactional data stored.
- Companywide adoption - a user-friendly interface enables users across all departments to access and analyze their own data, not just IT experts or data analysts. Enhancing collaboration and fast decisions-making.
- All-in-one platform - Along with a BI Analytics foundation, Phocas offers comprehensive financial planning products that work together smoothly, including Financial Statements, Budgets and Forecasts, and Rebates.
Data analytics, or business intelligence (BI), is the process of interpreting key business data to understand how an organization is performing, both financially and operationally.
Data analytics software is designed to retrieve, analyze, transform, and report on business data and metrics. This software provides organizations with an integrated view of their overall business by combining multiple data sets, such as enterprise resource planning (ERP) systems, CRM, HR, Payroll and e-commerce. BI can also be used to identify trends, uncover insights, and make informed business decisions.
Financial statement software is a program designed to automate the process of creating reports such as profit and loss (income statement), balance sheet and cashflow statements. It achieves this through the extraction of real-time data from ERP, CRM and multiple other data sources, and helps to ensure accuracy, consistency, and compliance with accounting standards.
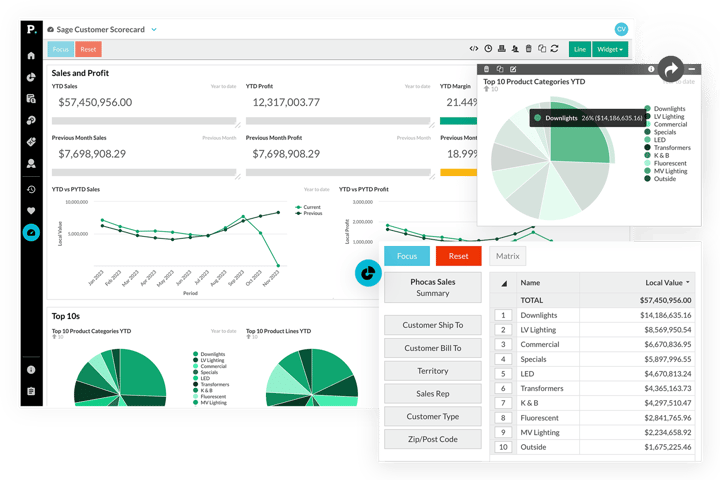
Statements are fully customizable to suit your business needs with an intuitive interface that enables free-form data analysis. Visualizations such as dashboards, graphs, charts and Sparklines also help to connect the wider business to performance as it's easy to provide an at-a-glance view of your finances.
There are several benefits of using a BI and FP&A platform over Excel or other manual reporting methods:
-
Time-saving: It frees up the finance team from time-consuming reporting tasks by automating entire processes, allowing for faster reporting, consolidation, and customization.
-
Accuracy: Data is pulled directly into the platform which ensures accuracy and reduces the risk of errors that can occur when maintaining and reworking static spreadsheets.
-
Standardization: It enforces standardization across financial statements, budgets and reports to ensure consistency and enables comparisons across different periods.
-
Collaboration: It enables teams to collaborate and work simultaneously in a secure and auditable environment. This can improve communication and reduce the risk of data discrepancies.
-
Reporting: It provides advanced reporting capabilities, such as customizable templates and interactive dashboards. This makes it easier to visualize data and identify patterns and trends.
-
Security: It provides better security features than Excel, including data encryption, user access controls, and audit trails. This can help protect sensitive financial data from unauthorized access or modification.
- Customizable: You can add calculations to the statements such as EBIT, margins and ratios
While Excel can be a useful financial reporting tool, a complete suite of analysis , financial statement and forecasting tools can help businesses streamline their financial reporting processes, improve accuracy, and make better, faster decisions based on real-time data.
Understand the past, operate better today, and plan well for the future


