View financial information in a chart
2:43 min
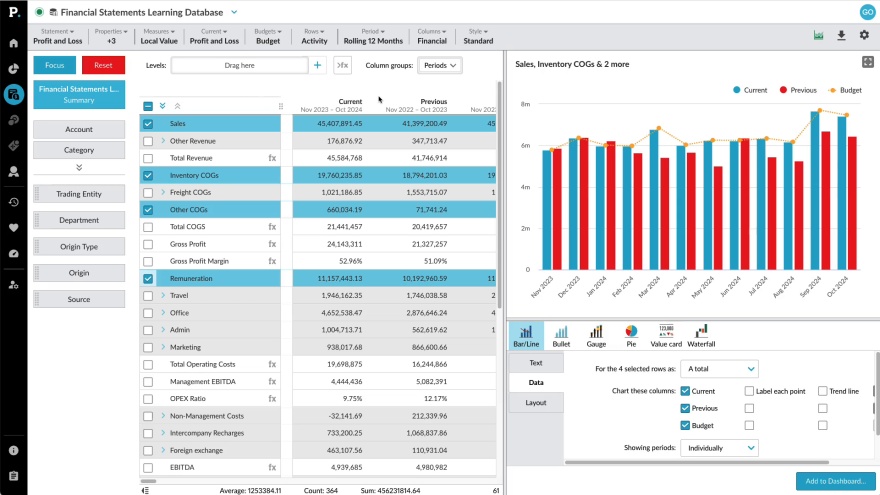
Learn how to use charts to visually explore and interact with your financial information and spot trends at a glance.
Supporting documentation
Phocas product
Category

Related video tutorials
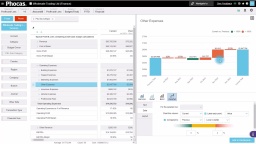
Highlight financial performance using a waterfall chart
This video shows how to use a waterfall chart to highlight financial performance over time, and use the chart in matrix mode to see how entities have contributed to that performance.
3:35 min
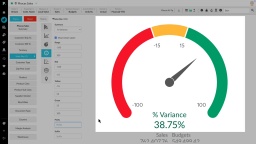
Create KPI-style gauge, summary and bullet charts
Discover how to track key performance indicators using KPI chart types in an Analytics database. In chart view, explore Gauge, Bullet, and Summary charts to visualize business goals and targets, ensuring performance insights are clear and easy to monitor.
3:25 min
Create a financial statement
Learn how to create a custom financial statement to suit your business needs from scratch.
3:20 min
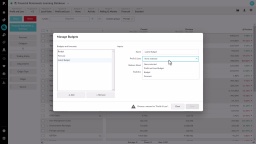
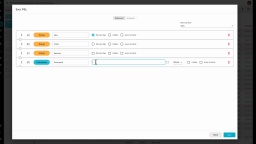
Manage budget streams
Learn how to manage your budgets using the Budget menu in Financial Statements. You'll see how budgets are displayed in the Budgets menu, allowing you to easily switch and adjust the budget data shown in your statement.
1:32 min