
Managing sales in a distribution business without measuring key performance indicators (KPIs) is like maintaining your home without tools or a schedule. You don’t notice a leak until the damage is severe. Instead of making progress, you waste time searching for the right tools or calling an expert for simple fixes. Without the right KPIs, inefficiencies can go unnoticed, leading to cashflow issues and lost sales.
A business intelligence platform acts as both a well-organized toolkit and a detailed record of completed work and parts used—alerting you to potential issues before they become costly while providing insights into what has worked and what hasn’t. Automation streamlines workflows, helping sales teams focus on high-value activities rather than repetitive reporting tasks.
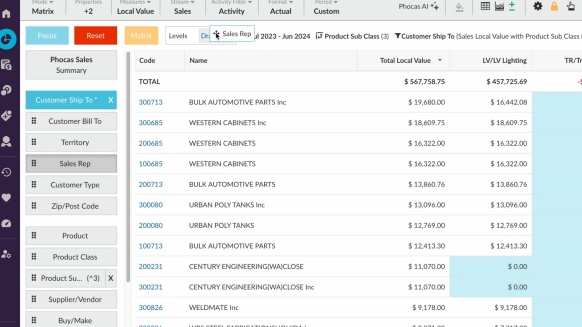
With real-time dashboards displaying sales KPIs specific to your distribution business, you see accurate data to measure sales performance against budget, identify optimization opportunities and drill into any variable for further investigation. Data-driven decisions improve customer experience and support continuous improvement.
How a business intelligence platform works with your ERP
Many salespeople struggle to extract meaningful data from NetSuite or Infor ERPs due to their complexity. Adding a compatible data platform like Phocas creates a streamlined, centralized hub for analysis and decision-making.
A data platform integrates with your ERP to serve as a single source of truth for all business data. Business intelligence takes information from ERP, CRM, eCommerce, inventory management, marketing, operations and supply chain systems to create a holistic view of your business. With easy-to-understand charts, graphs, and tables, decision-makers can quickly spot trends and act proactively. Branch managers and front-line sales teams gain access to shared insights, enabling them to track the right KPIs for their roles.
What are sales distribution KPIs?
A sales distribution KPI is a measurable indicator used by distribution businesses to monitor sales performance, product turnover and customer expectations. These metrics help sales teams identify inefficiencies, uncover new opportunities and enhance customer relationships.
As a business Intelligence software provider for distribution businesses, Phocas has helped thousands of sales teams define and refine their KPIs. Below are essential sales measures to get you started or to benchmark against your existing metrics.
7 key metrics to measure
1. Sales revenue across variables
Tracking revenue kpis helps identify top-performing products, customers and regions. These insights drive smarter pricing, inventory planning and sales strategies.
Formulas:
-
Total Revenue = Sum of total number of sales transactions
-
Revenue Growth (%) = ((Current period revenue - Previous period revenue) / Previous period revenue) × 100
-
Actuals to Budget (%) = (Actual sales revenue / Budgeted sales revenue) × 100
-
YoY Performance (%) = ((Current year revenue - Previous year revenue) / Previous year revenue) × 100
-
Profit Margins (%) = ((Revenue - Cost of Goods Sold) / Revenue) × 100
-
Performance by Region = Sales revenue by region / Total sales revenue
With Phocas, sales teams can access real-time dashboards to analyze sales KPIs and optimize performance.
2. Forecast accuracy
Accurate sales forecasts enhance resource planning, warehouse management and cashflow stability. Historical sales data, CRM pipeline data and actual sales figures are necessary for this KPI.
Formula:
-
Forecast Accuracy (%) = ((Actual Sales - Forecasted Sales) / Forecasted Sales) × 100
3. Sales Rep performance in detail
These KPIs evaluate individual and team contributions, helping managers set realistic targets and identify high performers.
Formulas:
-
Sales Rep Performance (%) = (Individual Sales / Sales Target) × 100
-
Close-Win Rate (%) = (Number of Won Deals / Total Opportunities) × 100
-
New Customers Acquired = Count of new customers in a period
-
Declining Customers = Count of customers with decreased purchases in a period
4. Cross-selling and upselling KPIs
These KPIs measure the effectiveness of increasing revenue per customer through optimization strategies.
Formulas:
-
Cross-Sell Rate (%) = (Customers Buying Multiple Products / Total Customers) × 100
-
Upsell Rate (%) = (Revenue from Upsells / Total Revenue) × 100
5. Customer satisfaction and retention
High retention rates and strong customer satisfaction signal a positive customer experience and sustainable revenue.
Formulas:
-
Customer Retention Rate (%) = ((Customers at end of period - New Customers) / Customers at start) × 100
-
Churn Rate (%) = (Customers lost / Total customers at start) × 100
-
Customer Lifetime Value (CLTV) = (Average purchase value × Purchase frequency × Customer lifespan)
6. Average order value (AOV)
Higher AOV indicates better customer expectations and spending behavior.
Formula:
-
AOV = Total revenue / Number of orders
7. Product performance, margin and variance
For distributors managing thousands of SKUs, automation simplifies product performance tracking.
Formulas:
-
Gross Margin (%) = ((Revenue - Cost of Goods Sold) / Revenue) × 100
-
Price Variance (%) = ((Actual Price - Standard Price) / Standard Price) × 100
-
Units Sold = Total count of units sold in a period
The value of self-service reporting
When reporting is self-service you avoid bottlenecks internally. Sales teams can review KPIs instantly leading to more data-driven decisions. Custom dashboards allow easy monitoring, with the flexibility to drill into underlying data.

Distribution industry case study
An international distributor of lubricants integrated Phocas with its NetSuite ERP for real-time access to sales data. Craig Roberts, CFO at TotalEnergies, explained how Phocas empowers sales managers across all branches.
“Our New Zealand branch uses a KPI dashboard to track budgets, sales mix, gross profits, and margins.” Roberts also highlighted the importance of access to historical sales data.
“If a customer hasn’t purchased in the last quarter but did in the one before, we follow up. Sometimes it's seasonal, but being aware of these trends is crucial.”
By integrating a BI tool like Phocas with NetSuite or Infor ERP, distribution sales teams get real-time visibility into sales performance. The platform automates KPI tracking, reducing inefficiencies and allowing sales teams to focus on improvement.

Empowering businesses with intuitive data analytics, driving informed decisions for growth and profitability. We make people feel good about data.


Find out how our platform gives you the visibility you need to get more done.
Get your demo today