Dynamic, custom SAP financial reporting
Quick, obligation free

Streamline financial reporting with Phocas + SAP - 1:17s
SAP-compatible software
- SAP Business One [SAP B1]
- SAP By Design
- SAP Hana
- SAP ECC 6
All your data in one place
- As Phocas offers FP&A built on a BI foundation, it excels at integrating with multiple data sources; ERP, CRM, sales, inventory, AR/AP, purchasing, Excel spreadsheets
- Data automatically consolidates into one platform, making it faster and easier to access your SAP ERP data
- Secure data warehousing for multiple sources is all included, plus data is mapped to ensure it's matched for seamless updates and ongoing validation
- The Phocas platform handles vast amounts of data while maintaining faster, more reliable performance
- Phocas is a great fit for distribution, manufacturing and retail businesses.

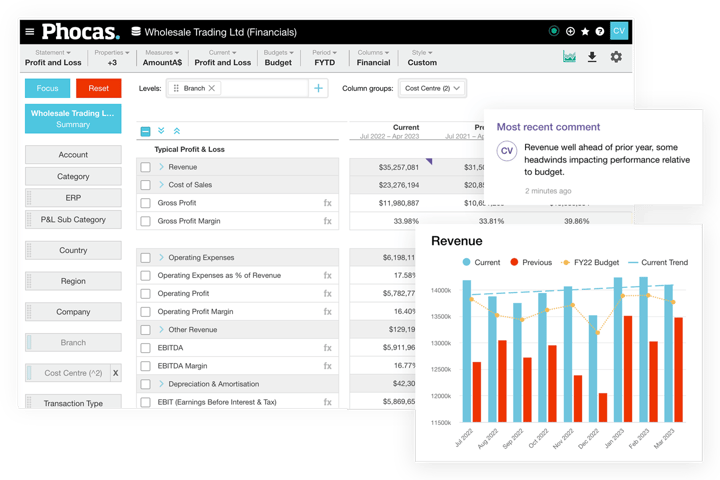
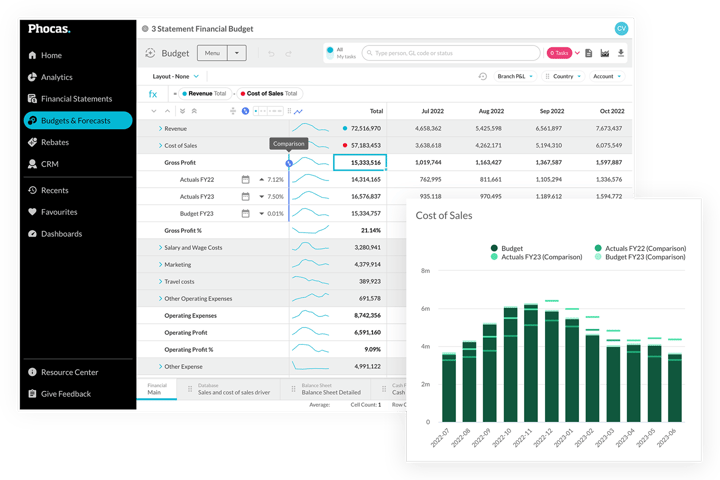
Fast SAP financial reporting
- Automatically transform ERP data into structured, up-to-date income statement (P&L), balance sheet and cashflow statements in minutes, not hours
- Remove manual work by automating reports for cross-functional teams
- Have confidence in consolidated reporting data that refreshes automatically; stop manipulating spreadsheets manually
- Leverage prebuilt templates, formulas and ratios.

Make fast informed decisions
“Before Phocas, we were using SAP Business One to generate reports. It took quite a bit of time. We brought in Phocas and reporting has been instant. The ability to use Phocas on your mobile phone has been great. It makes things much easier to track”.
Theo Hatzis, National Sales Support Manager, ICCONS
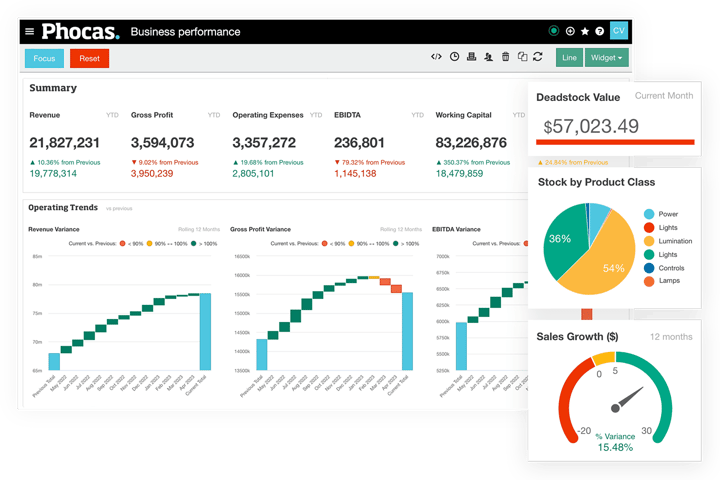
Enhanced SAP FP&A
- Critical financial data sits in an intuitive data analytics environment, making it easier to analyze
- Drill into data and find instant answers, enabling a faster response to multiple scenarios at once
- Gain full visibility of your cashflow, streamline inventory management, and analyze sales and revenue data to identify trends and growth opportunities
- Compare actuals against budgeted performance and make informed decisions on how to allocate resources going forward.

With Phocas, there is more collaboration and more data sharing. People feel empowered, more in control and responsible for their numbers.
Having access to insights frequently means you can make decisions faster and allocate resources correctly.
SAP + Phocas customer
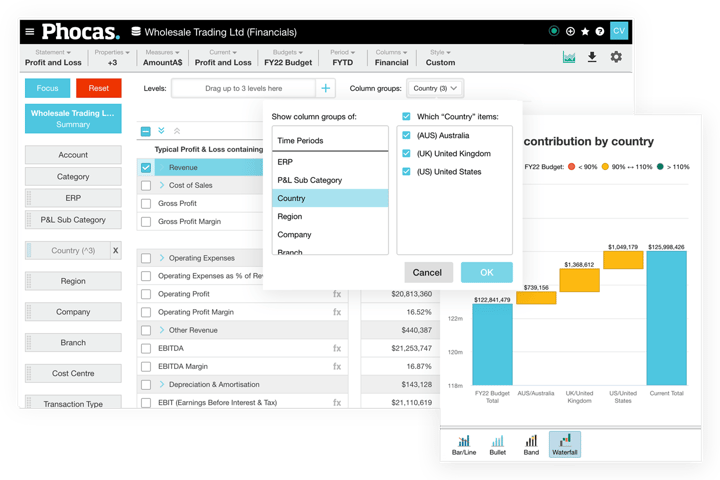
Self-serve SAP reports
- Effortlessly customize financial reports without complex SQL or continuously outsourcing customizations at an additional cost
- Include various reporting levels; multi entity, branch, country, cost centres, without the need for complex data manipulation
- Create and save custom filters such as product, customer or time period - apply them to reports to make then more targeted
- Add visualizations or calculations such as EBIT, margins and ratios that update automatically.

SAP + Phocas customer
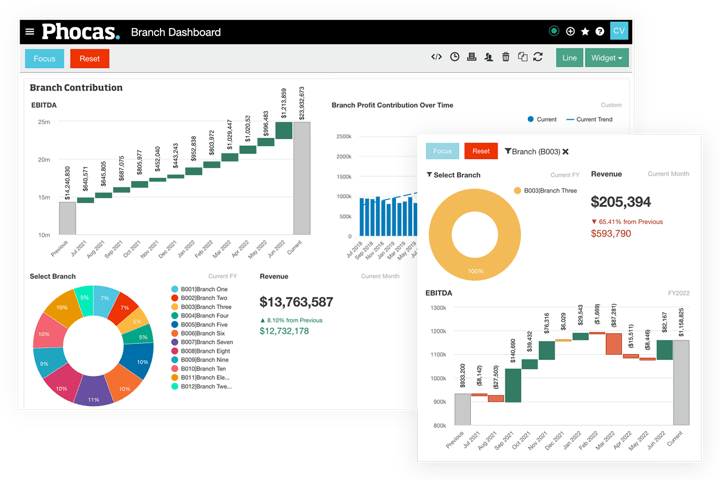
Visualize your FP&A story
- Build, customize and share unlimited dashboards and workflows, creating a clear business overview
- Visualize financial ratios and KPIs side-by-side to improve understanding of the performance of different entities and branches
- Quickly switch from visualizations to underlying data where you can slice and dice the metrics
- Graphs, pie charts and Sparklines (mini charts) make your findings easy to understand at a glance.

Empower and connect cross-functional teams
- Sales teams can review their own income statement (P+L), then analyze their revenue and expenses by a number of variables
- Trust the actuals with no second guessing as formulas and ratios are baked into the tool
- Provide branches or regional teams with permission-based access without affecting the general ledger.

See how Phocas stacks up against SAP Financial Management tools
When compared with SAP Analytics Cloud and SAP BPC products Phocas out performed on key metrics around reporting and ease of use. With Phocas you can be sure you're choosing a tool that is easy to use and fit for purpose.
Scale with FP&A + BI together
- Phocas offers BI Analytics, Financial Statements, Budgets & Forecasts and Rebates products that integrate seamlessly with SAP ERP systems
- No need to purchase all platform products together, simply choose what you need now and add more when you need them

Phocas powers thousands of data-driven companies worldwide
Fast implementation, full support
Frequently asked questions
Phocas is a business planning and analytics platform while SAP ERP systems are designed to manage various aspects of business operations. When integrated, Phocas enables companies to manage their operations more effectively in a various ways, such as:
- Powerful business intelligence analytics - Phocas collects and consolidates huge amounts of data from multiple business sources, empowering SAP ERP users with fast, easy access to real-time data within one platform source.
- Custom reporting - Reports and dashboards are customizable to meet specific business needs and can be created by all users. Insights and metrics that may not be readily available in standard SAP ERP reporting tools can be extracted with ease. Design your own reports that offer a deeper understanding of business performance.
- In-depth analytics - a unique ad hoc analysis layer, The Grid, enables all users to perform in-depth analysis. Drill down to transactional level and pivot the data in multiple ways such as by customer, branch, product or region.
- High performance - By integrating your SAP ERP with Phocas, you'll achieve lightening fast loading times, regardless of the volume of transactional data stored.
- Companywide adoption - a user-friendly interface enables users across all departments to access and analyze their own data, not just IT experts or data analysts. Enhancing collaboration and fast decisions-making.
- All-in-one platform - Along with a BI Analytics foundation, Phocas offers comprehensive financial planning products that work together smoothly, including Financial Statements, Budgets and Forecasts, and Rebates.
Yes - Phocas specializes in combining business data, most often ERP and financial data, with other non financial data sources. Providing one trusted platform to measure, track and plan your ongoing business operations quickly and easily.
Phocas started as a BI solution, so we understand the ins and outs of data manipulation. Our customers loved the enhanced capabilities that Phocas brought to their ERP that they started asking for financial analysis and budgeting and forecasting capabilities too.
Our focus is creating software and tools that anyone in your organization can use to understand sales, operations and logistics, making sure that your team can plan and forecast based on a solid foundation of trustworthy data.
Data analytics, or business intelligence (BI), is the process of interpreting key business data to understand how an organization is performing, both financially and operationally.
Data analytics software is designed to retrieve, analyze, transform, and report on business data and metrics. This software provides organizations with an integrated view of their overall business by combining multiple data sets, such as enterprise resource planning (ERP) systems, CRM, HR, Payroll and e-commerce. BI can also be used to identify trends, uncover insights, and make informed business decisions.
This is the process by which businesses regularly plan, review and control their finances.
The budget is a company's financial plan of intent for 12-months. This will incorporate data from finance, operations, sales, inventory and other company information to enable them to set goals and to monitor and manage their finances.
The forecast is a more detailed financial plan for a set amount of time, such as the last 6 or 3 months of the financial year.
Budget forecasting is when businesses regularly track actual performance numbers and compare them to the budget. Any insights or risks gleamed from this assessment can then be used to re-forecast the remainder of the budget period. This way, potential issues can be mitigated before they become a major risk, or swift action can be taken when responding to rapid economic or environmental change.
When you’re armed with this information in real-time, you have more control of your financial position throughout the year. It also enables you to take take action to avoid greater risks in the long term, while at the same time helping you to achieve your business goals.
Financial statement software is a program designed to automate the process of creating reports such as profit and loss (income statement), balance sheet and cashflow statements. It achieves this through the extraction of real-time data from ERP, CRM and multiple other data sources, and helps to ensure accuracy, consistency, and compliance with accounting standards.
Statements are fully customizable to suit your business needs with an intuitive interface that enables free-form data analysis. Visualizations such as dashboards, graphs, charts and Sparklines also help to connect the wider business to performance as it's easy to provide an at-a-glance view of your finances.
There are several benefits of using financial data analysis platform over Excel or other manual reporting methods:
-
Time-saving: It frees up the finance team from time-consuming reporting tasks by automating entire processes, allowing for faster reporting, consolidation, and customization.
-
Accuracy: Data is pulled directly into the platform which ensures accuracy and reduces the risk of errors that can occur when maintaining and reworking static spreadsheets.
-
Standardization: It enforces standardization across financial statements, budgets and reports to ensure consistency and enables comparisons across different periods.
-
Collaboration: It enables teams to collaborate and work simultaneously in a secure and auditable environment. This can improve communication and reduce the risk of data discrepancies.
-
Reporting: It provides advanced reporting capabilities, such as customizable templates and interactive dashboards. This makes it easier to visualize data and identify patterns and trends.
-
Security: It provides better security features than Excel, including data encryption, user access controls, and audit trails. This can help protect sensitive financial data from unauthorized access or modification.
- Customizable: You can add calculations to the statements such as EBIT, margins and ratios.
While Excel can be a useful financial reporting tool, a complete suite of analysis, financial statement and forecasting tools can help businesses streamline their financial reporting processes, improve accuracy, and make better, faster decisions based on real-time data.
Understand the past, operate better today, and plan well for the future
