Epicor financial reporting & analysis
EDA Financial Statements explained in under 90 seconds
BI-driven financial statements
EDA Financial Statements is built on a Business Intelligence foundation. It automatically consolidates and structures financial and operational data such as accounts receivable, accounts payable, Epicor ERP data, HIRS, CRM or warehouse data. It then transforms it into dynamic profit and loss, balance sheet and cashflow statements.
Financial statements for Epicor BisTrack, Epicor E8, E9, and E10, Epicor Eagle, Epicor Eclipse, Epicor LumberTrack, Epicor Prelude, Epicor Prophet 21, Epicor Vision, Epicor CMS, Epicor iScala.
Self-serve financial reports
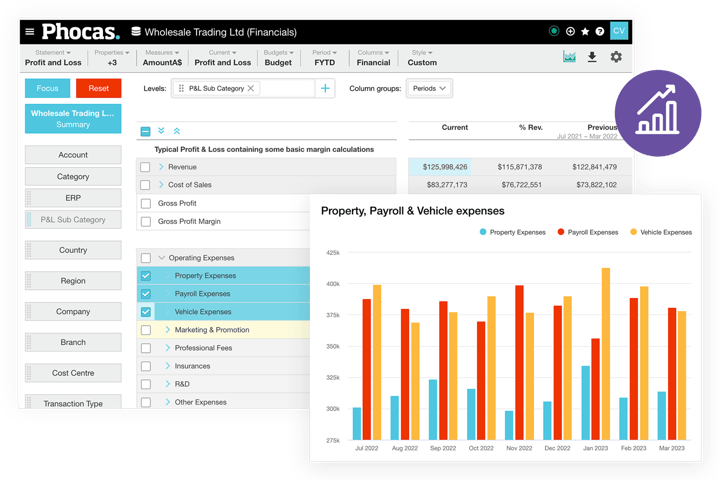
- Easy: create and automate P&L (income statement), balance sheet and cashflow statements for cross-functional teams in minutes.
- Split: quickly split reports like profit and loss to compare divisions, subsidiaries, regions, cost centres.
- Analyze: track live actuals and compare across time periods and against budgets, then drill into the underlaying detail.
- Customize: add visualizations or calculations such as EBIT, margins and ratios that auto update.
Why Epicor users love EDA Financial Statements
Hear from Epicor customers first-hand about their experience integrating EDA Financial Statements with their ERP data.
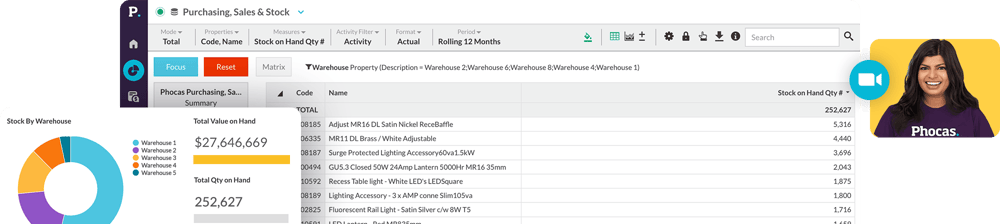
Auto consolidation
- Efficient: save hours, even days of data wrangling with financial and operational data auto consolidated.
- 360 view: data is pulled from Epicor ERPs, subsidiaries, branches, countries into one consolidated view.
- Compare: Quickly switch from a high-level overview to analyze against division, time period or branch
- Migration: can be quickly implemented to provide uninterrupted dataflow, reporting, dashboards during ERP migrations.
Epicor + Phocas customer
EDA Financial Statements in action: Take a video tour
- Automate month-endSpeed up month-end close by 50%. See how Phocas automatically structures your data into up-to-date financial statements, saving you hours of number-crunching.
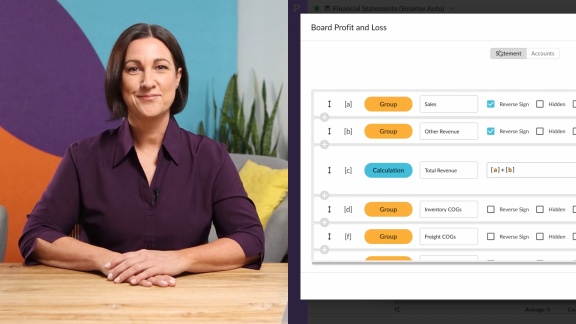
- Customize statementsPhocas makes customization a breeze. Learn how users can easily tailor statement views to suit specific needs without the hassle of spreadsheets.
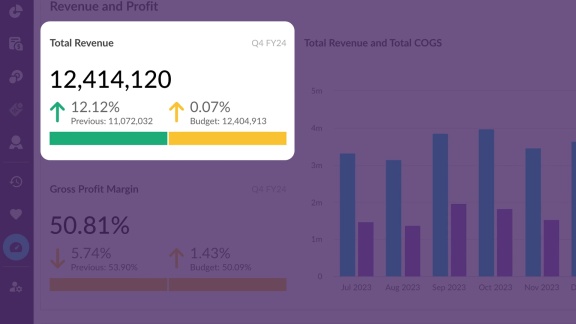
- Track performanceWith Phocas, dynamic, interactive statements and dashboards allow you to track performance at any time and to freely investigate your financials.
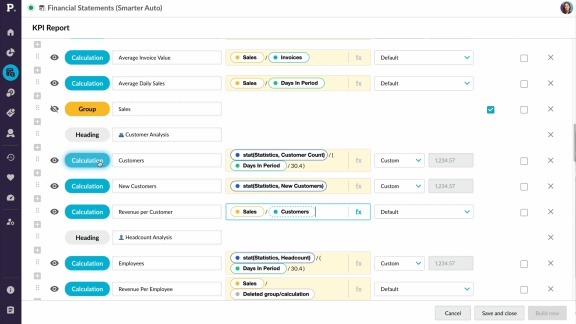
- Financial ratiosPhocas simplifies the process of creating and tracking essential financial ratios. In this video, learn how to build custom ratios, like revenue per customer, to keep your business on top of its key performance metrics.
- Spot opportunities & risksWith Phocas, you can easily check for errors, spot potential risks and uncover the root causes very quickly by drilling down to the transactional data.
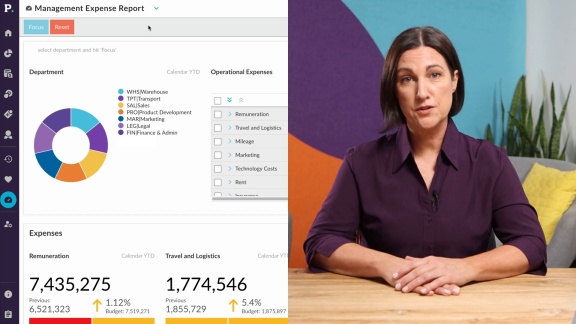
- Management reportingPhocas makes it easy to create tailored, up-to-date management reports and board-level dashboards. Customize views for each department, and share insights effortlessly, all from one platform.
- Visual storytellingSee how Phocas brings performance metrics to life with dashboards and charts, making it easier for non-financial team members to engage with their numbers.
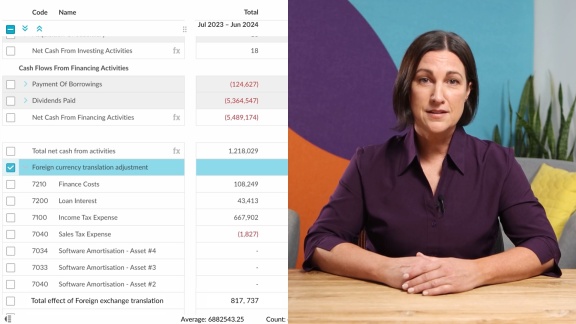
- Financial consolidationPhocas makes it easy to report across multiple currencies and subsidiaries in your Profit and Loss, balance sheet and cashflow statements.
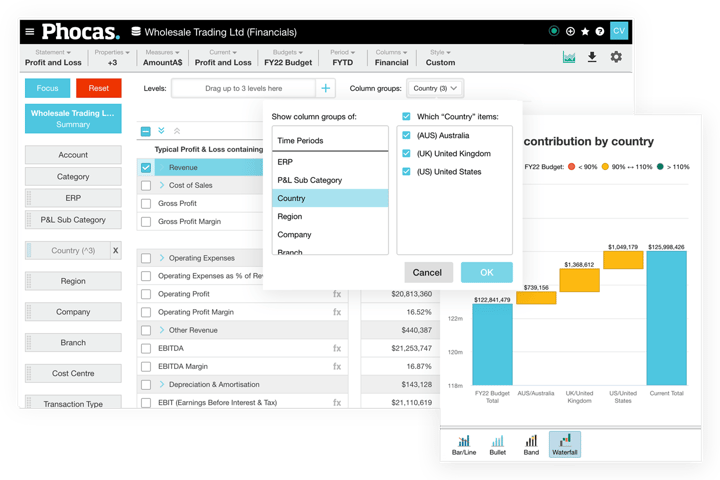
Customize
- Effortlessly customize reports without complex SQL for branches, divisions, departments, subsidiaries.
- Empower teams with self-serve dashboards updated with real-time performance insights.
- Include various reporting levels; multi entity, branch, country, cost centres, without the need for complex data manipulation
-
Control access securely without touching the general ledger.
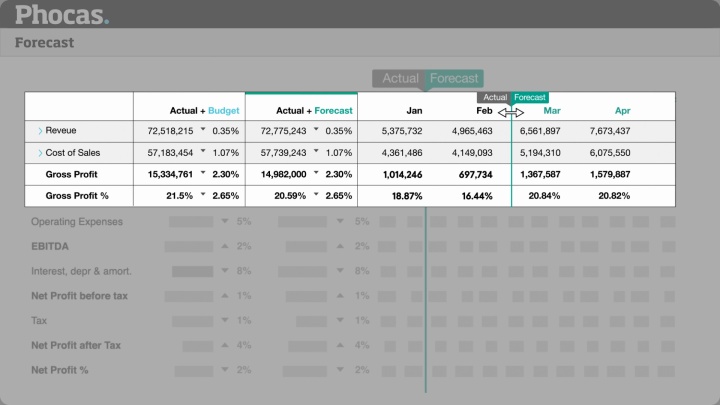
Financial planning
- Link budgets to financial reports and make timely adjustments after month-end.
- Track live actuals against budgeted performance and reforecast where needed.
- Create rolling forecasts.
- Build your budget model once in EDA Budgets & Forecasts, and each year after, your data auto-loads.
Visualize
- Build, customize and share dashboards and workflows, creating a clear business overview
- Visualize financial ratios and KPIs side-by-side to improve understanding of the performance of different entities and branches
- Quickly switch from visualization to underlying data where you can slice and dice the metrics
- Impactful charts and prompts make it easy to understand
Engage cross-functional teams
- Sales teams can review their own income statement (P+L) and then analyze their revenue and expenses by a number of variables
- Unite your team with a single set of accurate numbers
- Provide branches or regional teams with permission-based access to run their own numbers and to view statements without affecting the general ledger
All-in-one platform
The EDA Suite integrates directly with your Epicor ERP and provides you with a single platform for business intelligence and financial planning that your whole business can use.
Each product within The Suite works harmoniously together, helping you carry out deeper analysis and data-driven planning with confidence.
Frequently asked questions
Financial statement software is a program that is designed to help finance teams prepare financial statements and reports. It automates the process of creating financial statements by pulling data from ERP, CRM and multiple other data sources, and can help to ensure accuracy, consistency, and compliance with accounting standards.
Some financial statement software also includes advanced features such as financial analysis tools, budgeting and forecasting capabilities, and customizable report templates.
There are several benefits of using financial statement software over Excel or other manual reporting methods:
-
Time-saving: It frees up the finance team from time-consuming reporting tasks by automating the entire process, allowing for faster reporting, consolidation, and customization.
-
Accuracy: Data is pulled directly into the software which ensures accuracy and reduces the risk of errors that can occur when maintaining and reworking static spreadsheets.
-
Standardization: It enforces standardization across financial statements to ensure consistency in reporting and enables comparisons across different periods.
-
Collaboration: It enables teams to collaborate and work simultaneously in a secure and auditable environment. This can improve communication and reduce the risk of data discrepancies.
-
Reporting: It provides advanced reporting capabilities, such as customizable templates and interactive dashboards. This makes it easier to visualize data and identify patterns and trends.
-
Security: It provides better security features than Excel, including data encryption, user access controls, and audit trails. This can help protect sensitive financial data from unauthorized access or modification.
- Customizable: You can add calculations to the statements such as EBIT, margins and ratios
While Excel can be a useful financial reporting tool, financial statement software can help businesses streamline their financial reporting processes, improve accuracy, and make better, faster decisions based on real-time data.
The three common financial statements are:
-
Balance sheet: This statement provides a summary of a company's financial position at a particular point in time. It shows the assets, liabilities, and equity of the company.
-
Income statement: Also known as a profit and loss statement, this statement shows a company's income and expenses over a period of time. It provides information on the company's profitability and financial health.
-
Cash flow statement: This statement shows the inflows and outflows of cash for a company over a period of time. It provides information on the company's ability to generate cash and its liquidity position.
Yes, financial statements are a key component of financial analysis. They provide essential financial data used to assess a company's financial health, performance, and potential for future growth.
Financial statements are used to evaluate a company's liquidity, profitability, solvency, and stability to develop a complete picture of a company’s financial profile.
Business people use financial statements to assess the company's performance against industry standards, identify trends and patterns, evaluate the company's strengths and weaknesses, and forecast future performance.
Financial statements are also used by investors, lenders, and other stakeholders to make decisions about investing or lending to the company. They are an essential component of financial analysis and play a crucial role in the decision-making processes.
Choosing the best financial statement software for your business depends on your specific needs, budget, and the features of the software. Here are some key features to consider when evaluating financial statements software:
-
Customizable statements and reports: Custom reporting allows you to create and automate reports specific to the nuances of your business.
-
Automatic data entry and reconciliation: Software that automatically imports and reconciles financial data from multiple sources can save you time and reduce errors.
-
User-friendly data visualization tools: Highly visualized, interactive, and customizable dashboard features allow you to quickly analyze and present financial data to stakeholders.
-
Budgeting and forecasting tools: Software that includes budgeting and forecasting functionality can help you plan and predict future financial performance to make informed business decisions.
-
Integration with other ERP or financial management tools: Look for software that integrates with your ERP or financial management tools (such as accounting software, payroll software, or tax software) so you can streamline your financial management processes.
-
Security and compliance features: Robust security and compliance features (such as data encryption, access controls, and audit logs) help protect your financial data and comply with industry regulations.
When evaluating software options, prioritize the features that are most important to your business needs, and choose software that offers the best combination of features, usability, and affordability.
Analytics is used in finance to help businesses make informed decisions . Here are some ways analytics is used in finance:
-
Risk management: Analytics can be used to identify and mitigate financial risks. By analyzing historical data and market trends, businesses can identify potential risks and take steps to minimize them.
-
Financial forecasting: Analytics can be used to forecast financial outcomes based on historical data and other variables. This can help businesses to better plan for the future.
-
Performance analysis: Analytics can be used to track and analyze financial performance metrics such as revenue, profitability, and return on investment. This helps businesses identify areas of underperformance and take corrective action.
-
Cost analysis: Analytics can be used to analyze and optimize costs in financial processes such as procurement, inventory and supply chain management. This helps businesses reduce costs and improve efficiency.
Analytics is becoming an increasingly important tool in finance, helping businesses to gain insights, make better decisions, and manage risks more effectively.