
Every day, the business world creates more than 495.89 million terabytes of data. While the volume of data is impressive – and growing – collecting big data for data sakes is really not that useful. Most of the types of data we generate today is unstructured, which means it comes in different formats, sizes, and even shapes. This means you need to order it so you can manage and analyze the data which is often difficult for companies. However, getting this work right means you'll have actionable data.
There is no prize for the company that owns the most data. Rather the real winners are the companies that can turn the endless streams of raw data into actionable insights that can help improve their businesses.
What is actionable data?
Actionable data is “information that can be acted upon or information that gives enough insight into the future that the actions that should be taken become clear for decision makers.”
In other words, while actionable data is a product of big data, it is not simply information stored in silos across your divisions. Actionable data is information that has gone through analytics and data processing and is presented in a clear, understandable and often visual way that is useful. It empowers the people and companies that use to recognize mistakes and capitalize on new opportunities, to enhance their performance, and make faster and more informed business decisions.
CIS Wired wrote, “What big data represents is an opportunity; an opportunity for actionable insight, an opportunity to create value, an opportunity to effect relevant and profitable organizational change. The opportunity lies in the which information is integrated, how it is visualized and where actionable insight is extracted.”
In even simpler terms, actionable data is business intelligence.
Using actionable insights to gain a competitive advantage
BI is literally the transformation of raw data into actionable insights for your business. In a world that produces trillions of gigabytes of data every day, companies are either drowning in information or they are learning how to use the data to their advantage. It has never been more important for companies to capture, manage and analyze their data to improve their business intelligence. Doing so creates a competitive advantage, an opportunity to improve customer satisfaction, a method to enhance inventory and optimize the supply chain, validation to pursue new markets; and evidence of growth. These are the key elements to becoming a data-driven organization.
Unfortunately, not every business understands how to get from data collection to actionable insights.
Typical challenges in getting actionable data
So what is really stopping business leaders from connecting the dots between data, analytics and business growth?
Of the CFOs and CIOs from companies surveyed by KPMG (four in 10) blamed their inability to integrate data technology into their existing systems and business models. Eight-five percent said they struggled with “implementing the correct solutions to accurate analyze and interpret their existing data.” They are finding it hard to make decisions with the data they have or how to use the data they collect.
Our customers also tell us that they do not fully understand how data and analysis can transform their business despite knowing it is crucial to their business. Many of these businesses are collecting information without an understanding of how to use it. Then they find data analytics and soon learn the benefits of actionable data.
Data-driven decision-making
A key outcome of actionable insights is data-driven decision making. Business people equipped with accurate metrics and data insights are empowered to make strategic choices with confidence. By leveraging structured data sets rather than gut instincts, people working in different areas across manufacturing, wholesale and distribution can optimize pricing strategies, reduce costs and enhance customer experiences. Data-driven decision making helps companies to act faster while reducing risks and driving growth.
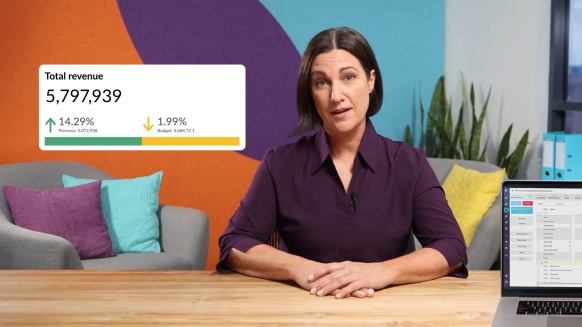
Data visualizations and dashboards
Data points are only useful if they are easy to understand and act upon. This is where visualizations and dashboards come into play. Dashboards provide an intuitive way to display critical business insights, allowing users to interact with and analyze data in real time. Visual representations such as charts, graphs, and heatmaps simplify complex data sets, making it easier to spot trends and patterns. Unlike static reports in Excel, interactive dashboards enable dynamic exploration of key metrics and KPIs, ensuring decision makers have access to the most relevant and up-to-date information. When combined with machine learning or artificial intelligence technology, dashboards can help predict future trends as well as inspire novice users to interrogate real-time data and obtain actionable insights.
Data analysis provides a clear and comprehensive picture
BI tools such as Phocas are so important because they make it quick to draw actionable insights from your business information so you can make data-driven decisions. You now have a purpose for the data you are collecting. Phocas BI pulls data from across your ERP and other data sources into a central platform and presents it in a visually compelling way that is easy to understand. You have the ability to drill down to a level of detail that reveals what needs to happen next with a customer, product, sales team, region or business. Phocas BI provides a clear and comprehensive picture that helps businesses connect the dots so they can take the necessary steps to grow your business.

Rick has decades of management experience in data and tech. He currently oversees the Phocas strategic partner model working with key ERP Publishers and buying groups such as Epicor, Kerridge Commercial Systems, Affiliated Distributors, Infor, Sage and SAP. Rick is a problem-solver and connects like-minded people.


Find out how our platform gives you the visibility you need to get more done.
Get your demo today