View financial information in a matrix (change column groups)
2:25 min
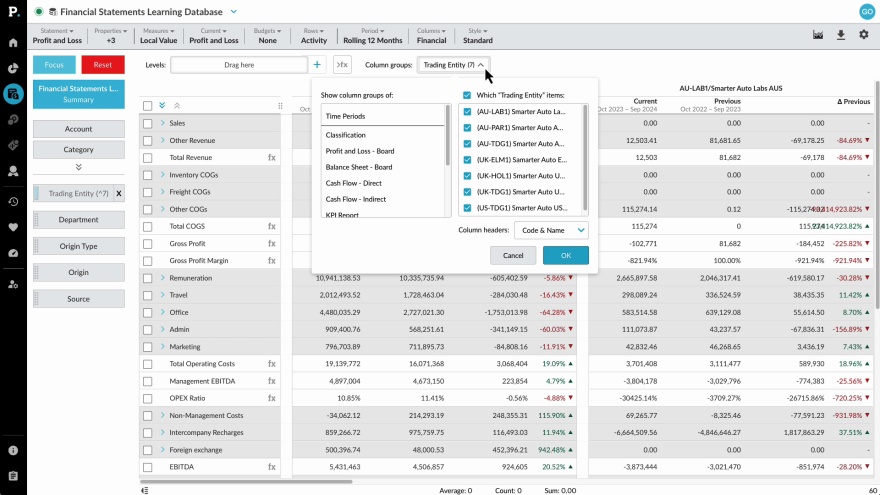
Learn how to use Column Groups to show financial data side-by-side in a matrix format. This setup allows for quicker comparisons and makes it easier to spot differences in performance.
Supporting documentation
Phocas product
Category

Related video tutorials
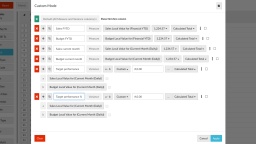
Use custom mode to show target performance
Learn how to use custom mode to add columns to the Phocas grid to compare sales and budget, track sales rep performance, and customize how your data is displayed.
5:06 min
Matrix Variance and Matrix Share mode
Learn how to use Matrix Variance mode to compare data across different periods by adding columns for the previous period and variance—perfect for spotting trends month-over-month or year-over-year. You'll also see how Matrix Share mode transforms your data into percentages, making it easy to analyze ratios, like the share of Product X versus Product Y.
3:13 min
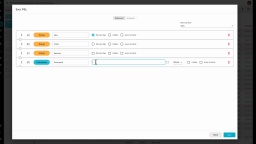
Create a financial statement
Learn how to create a custom financial statement to suit your business needs from scratch.
3:20 min
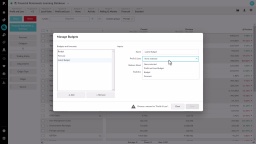
Manage budget streams
Learn how to manage your budgets using the Budget menu in Financial Statements. You'll see how budgets are displayed in the Budgets menu, allowing you to easily switch and adjust the budget data shown in your statement.
1:32 min