Home Academy Video tutorials

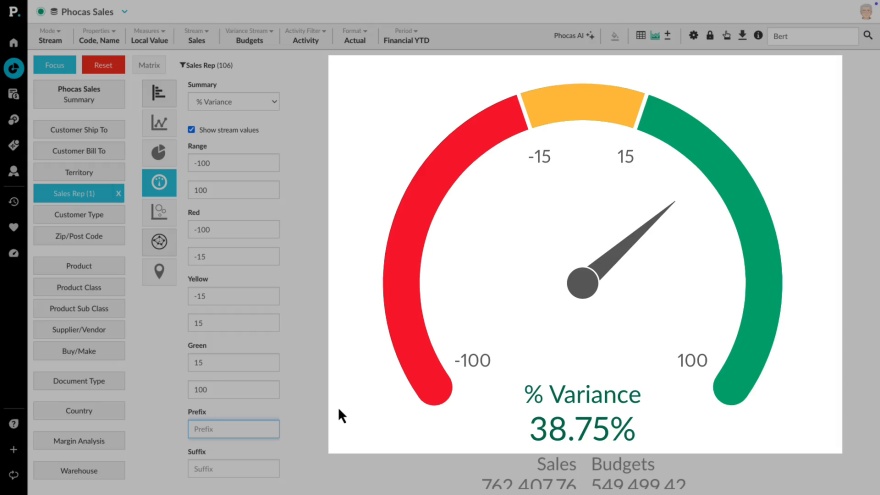
Summary charts 1

3:42 min
Summary charts 1
Learn how to display margin as a simple color-coded 'smiley'on the dashboard, using a summary chart. See Andy's 'Summary Charts 2' video in the Charts module to see how to use turn a favorite into a dashboard widget.

Supporting documentation

Phocas product
Analytics Analytics
Category
Phocas Software help and support
Help & support

Have questions or need to report an issue with a Phocas product?

Get support

Related video tutorials

Summary charts 2
Analytics Analytics

Summary charts 2

Use a summary chart to turn a favorite into a simple color-coded dashboard widget. See Andy's 'Summary charts 1' video in the Charts module to learn how to create a summary chart widget from scratch.
2:15 min
Manage favorites, dashboards, and subscriptions
Platform Platform

Manage favorites, dashboards, and subscriptions

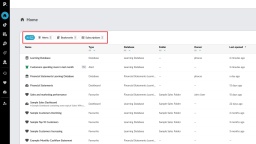
Learn how to manage and share favorites and dashboards with users, and discover how to subscribe them to email notifications to keep them updated on important changes in key data.
3:18 min
Homepage at a glance
Analytics Analytics

Homepage at a glance

Learn how to make the most of your homepage - the starting point to easily find databases, dashboards, favorites and recents.
2:11 min
Make your dashboard interactive
Platform Platform

Make your dashboard interactive

This video shows you how to take dashboards to a new level. With a few simple moves you can get dashboard widgets interacting with each other, make selections, focus and filter down to a fine level - all without leaving the dashboard.
2:10 min