Sort and summarize your data
2:13 min
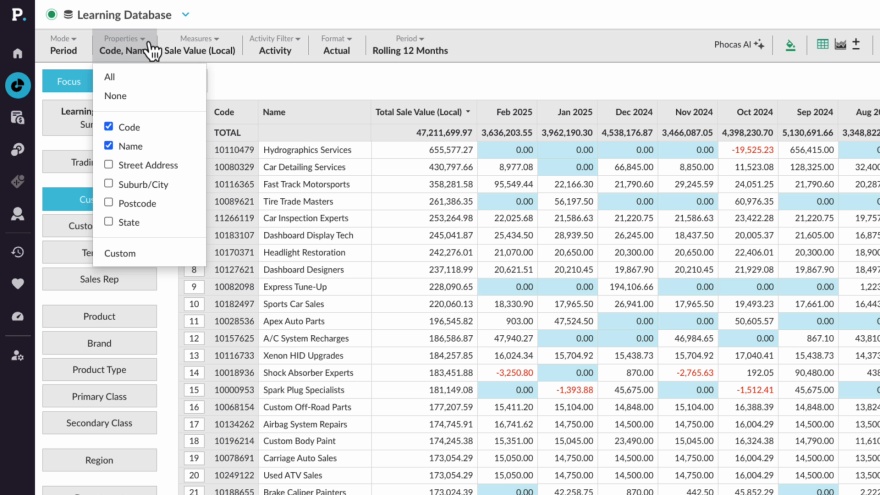
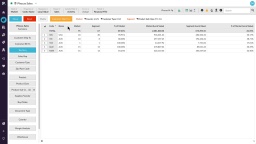
Learn how you can use the summary view and properties menu to summarize selected data, or narrow the view for a more detailed analysis.
Supporting documentation
Phocas product

Related video tutorials
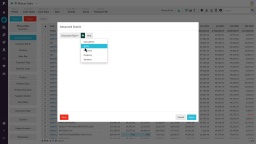
Narrow your search by entity or property
See how advanced search helps you quickly filter your data for a clearer starting point. Learn how to apply entity and property search rules to quickly narrow things down.
2:18 min
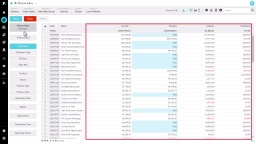
Matrix Variance and Matrix Share mode
Learn how to use Matrix Variance mode to compare data across different periods by adding columns for the previous period and variance—perfect for spotting trends month-over-month or year-over-year. You'll also see how Matrix Share mode transforms your data into percentages, making it easy to analyze ratios, like the share of Product X versus Product Y.
3:13 min
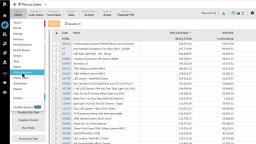
Change the mode
Learn how to switch modes to change the way your data is shown in the grid.
1:23 min
Use Market Mode to analyze market penetration
With Market Mode, you compare a market segment to the overall market using market mode. Learn how to define a market and a segment and how to specify what entities you want to count and compare.
2:50 min