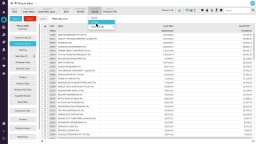
Add levels to the grid (nesting)
1:59 min

Learn how to bring together related data from different dimensions as an expandable report in the Phocas grid using the 'nest' feature. Grid nesting allows you to display up to three levels of detail, grouped by dimension.
Supporting documentation
Phocas product
Category

Related video tutorials
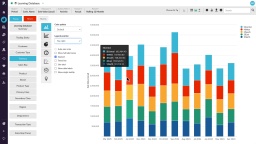
Configure your chart options
See how to change an axis starting point (using auto-axis scale), stack the chart values on top of each other rather than side by side or select and focus on a segment.
3:27 min
Change your data format
Learn how switching from actual figures to percentage share view can instantly reveal discrepencies between sales value and profitabilty.
1:47 min
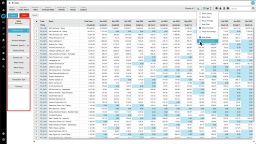
Gain more screen space and other tips
Learn how to streamline the grid for extra screen space and explore useful features like freezing the properties column, copying and pasting data, and various export options.
3:20 min
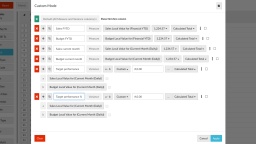
Use custom mode to show target performance
Learn how to use custom mode to add columns to the Phocas grid to compare sales and budget, track sales rep performance, and customize how your data is displayed.
5:06 min