Explore the Phocas grid
1:56 min
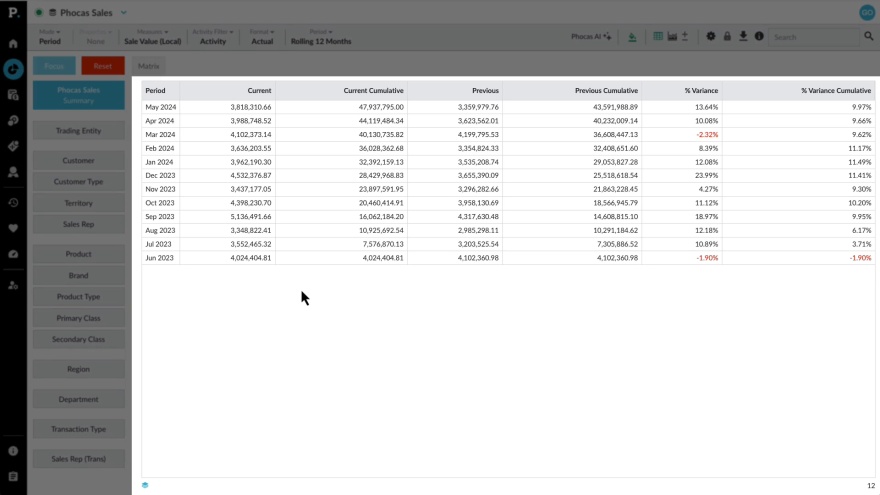
Here we show you how to get started in the Phocas analysis grid. Learn how to jump into your data from the home page, starting from a saved view or following your train of thought to change measures, date ranges and other views.
Supporting documentation
Phocas product
Category

Related video tutorials
Focus on grid data
Learn how to drill down into detailed data to uncover valuable insights for your business. You'll also discover how to filter data and focus on specific information to sharpen your analysis.
2:03 min
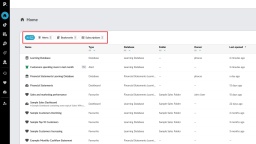
Homepage at a glance
Learn how to make the most of your homepage - the starting point to easily find databases, dashboards, favorites and recents.
2:23 min
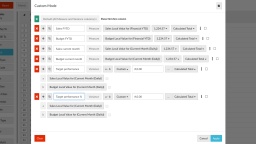
Use custom mode to show target performance
Learn how to use custom mode to add columns to the Phocas grid to compare sales and budget, track sales rep performance, and customize how your data is displayed.
5:06 min
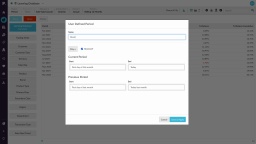
Add user-defined periods
Learn how to create custom user-defined "month to date" or "calendar year to date" periods from scratch and save them as new defined periods. Since they’re your custom periods, you’ll have complete control to edit or delete them whenever necessary.
4:55 min