Discover dashboards
1:51 min
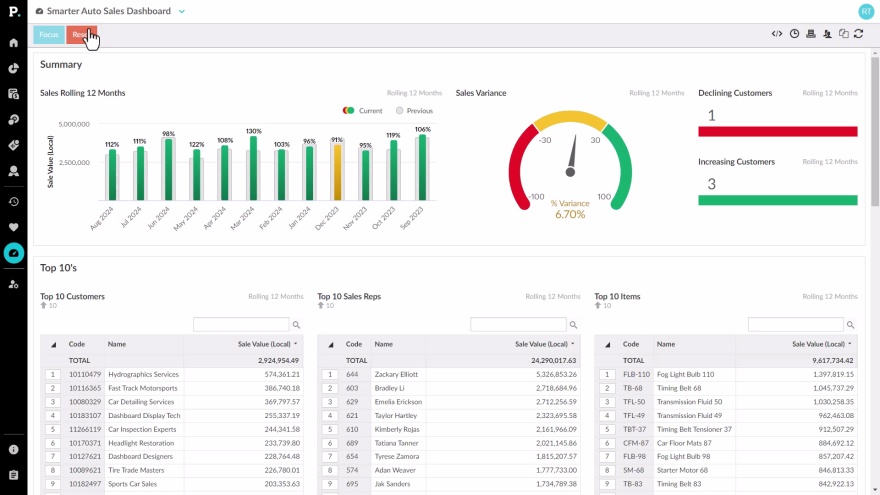
See just how user friendly a Phocas dashboard can be. Here we show you how to make some simple selections on a dashboard, focus, clear and reset.
Supporting documentation
Phocas product
Category

Related video tutorials
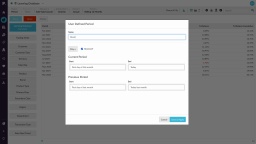
Add user-defined periods
Learn how to create custom user-defined "month to date" or "calendar year to date" periods from scratch and save them as new defined periods. Since they’re your custom periods, you’ll have complete control to edit or delete them whenever necessary.
4:55 min
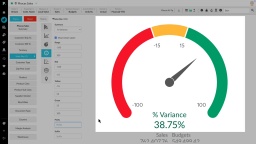
Create KPI-style gauge, summary and bullet charts
Discover how to track key performance indicators using KPI chart types in an Analytics database. In chart view, explore Gauge, Bullet, and Summary charts to visualize business goals and targets, ensuring performance insights are clear and easy to monitor.
3:25 min
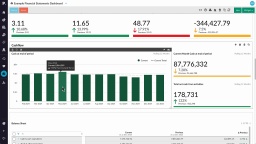
Explore and view dashboards
Discover just how user-friendly a Phocas Financial Statemetns dashboard can be! Learn how to make simple selections, narrow your focus, clear filters, and reset the dashboard with ease.
2:29 min
Perform an advanced search
Advanced search helps users build detailed reports by applying specific filters to narrow down data. Users can set multiple rules and combine them with conditions like AND or OR to customize and refine their search results. This feature is ideal for creating precise reports or favorites based on specific criteria.
3:32 min