Home Academy Video tutorials

Bullet charts

1:34 min
Bullet charts
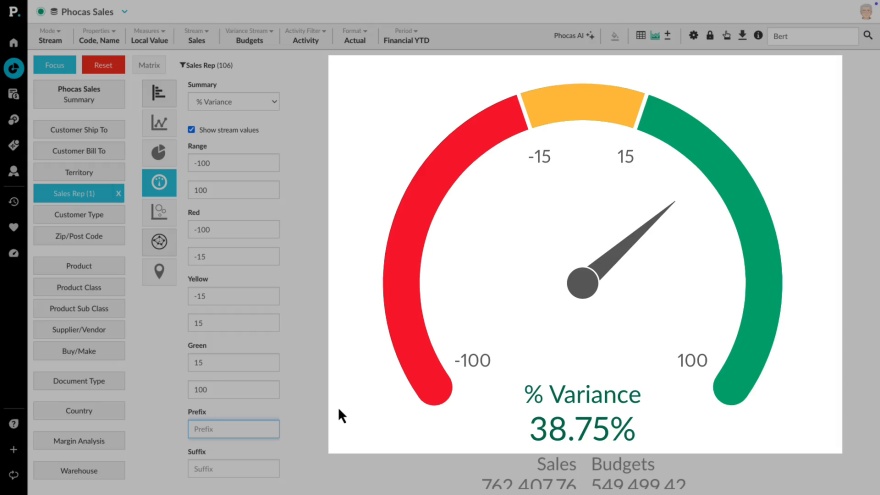
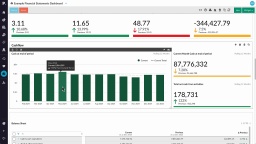
Learn how to use a bullet chart to display KPI performance against target for different areas or by total.

Supporting documentation

Phocas product
Analytics Analytics
Category
Phocas Software help and support
Help & support

Have questions or need to report an issue with a Phocas product?

Get support

Related video tutorials

Chart options
Analytics Analytics

Chart options

See how to change an axis starting point (using auto-axis scale), stack the chart values on top of each other rather than side by side or select and focus on a segment.
2:19 min
View financial information in a chart
Financial Statements Financial Statements

View financial information in a chart

Learn how to use charts to visually explore and interact with your financial information and spot trends at a glance.
2:43 min
Visualize your data in a chart
Analytics Analytics

Visualize your data in a chart

Discover how you can use charts to quickly visualize your data and spot trends at a glance. Charts are especially helpful when dealing with large datasets, allowing you to get an easy visual overview without scrolling through endless columns and rows in the grid.
1:22 min
Highlight financial performance using a waterfall chart
Financial Statements Financial Statements

Highlight financial performance using a waterfall chart

This video shows how to use a waterfall chart to highlight financial performance over time, and use the chart in matrix mode to see how entities have contributed to that performance.
3:35 min