Sage + Phocas
Dynamic, custom Sage financial statements
When financial reports are customizable and blend financial and operational data, it’s easy to onboard the wider business with the bigger financial picture.
Quick, obligation free

Streamline financial reporting with Phocas + Sage - 1:17s

Based on 270+ customer reviews on


Made for Sage
When you want more out of your Sage ERP, a certified partner like Phocas bridges the gap. With hundreds of existing Sage users, Phocas is designed to meet your needs.
- Sage 50
- Sage 100 CRE
- Sage 100 Contractor
- Sage 200
- Sage 300 CRE
- Sage Intacct
- Sage X3
All your data in one place
- The Phocas platform is built on a BI foundation, integrating with 200+ data sources; ERP, CRM, sales, inventory, AR/AP, purchasing, Excel spreadsheets
- Data automatically consolidates into one platform, making it faster and easier to access your Sage data
- Secure data warehousing for multiple sources is all included, plus data is mapped to ensure it's matched for seamless updates and ongoing validation
- The Phocas platform handles vast amounts of data while maintaining faster, more reliable performance
- Phocas is a great fit for distribution, manufacturing and retail businesses.

Self-serve Sage financial reporting
- Transform your Sage data into structured, up-to-date income statement (P&L), balance sheet and cashflow statements in minutes, not hours
- Remove manual work by automating reports for cross-functional teams
- Have confidence in consolidated reporting data that refreshes automatically; stop manipulating spreadsheets manually
- Leverage prebuilt templates, formulas and ratios.
Sage + Phocas customer Read case study
Empower everyone to do more
"It’s very rewarding to be able to give staff and teams access to data that they can understand and drill themselves."
Tim Barr, Head of Finance - Woodberry

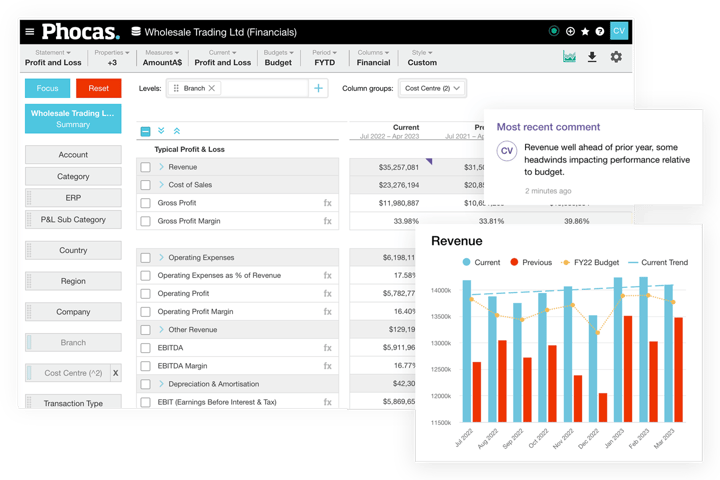
Enhanced analysis
- Critical financial data sits in an intuitive data analytics environment, making it easier to analyze
- Drill into data and find instant answers, enabling a faster response to multiple scenarios at once
- Gain full visibility of your cashflow, streamline inventory management, and analyze sales and revenue data to identify trends and growth opportunities
- Compare actuals against budgeted performance and make informed decisions on how to allocate resources going forward.

In Phocas, we can have financial statements consolidated or split any way we want. We can choose to see just revenue and profit or right down to individual expense lines.
— Scott Sokoly, Business System Administrator at Trade Supply Group.
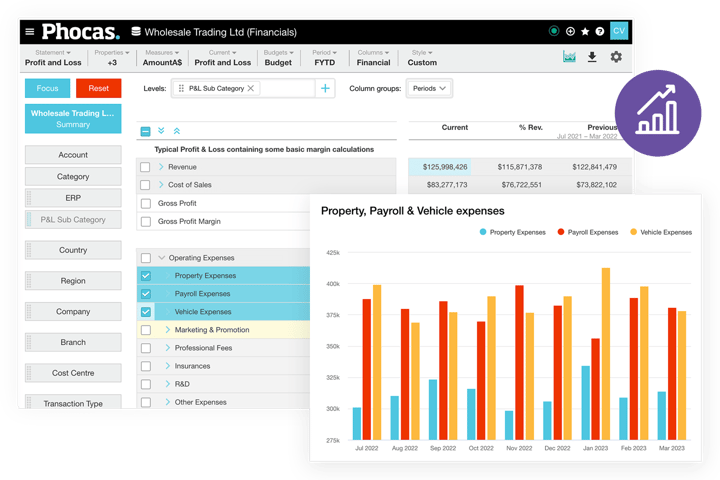
Custom Sage financial statements
- Effortlessly customize financial statements without complex SQL or continuously outsourcing changes at additional costs
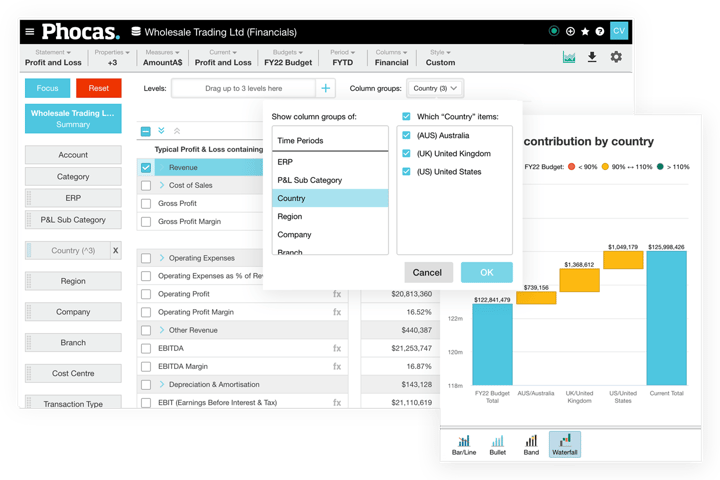
- Include various reporting levels; multi entity, branch, country, cost centres, without the need for complex data manipulation
- Create and save custom filters such as product, customer or time period - apply them to reports to make then more targeted
- Add visualizations or calculations such as EBIT, margins and ratios that update automatically.
Prior to Phocas Financial Statements, we would have to pull data, dump it into Excel and manipulate it before we could really see the results. Now we can just open it up and the statements are built, we no longer have to build them and manipulate them before we can analyze them. It’s real-time.
— Justin Caper, Controller at American Metals Supply Company.
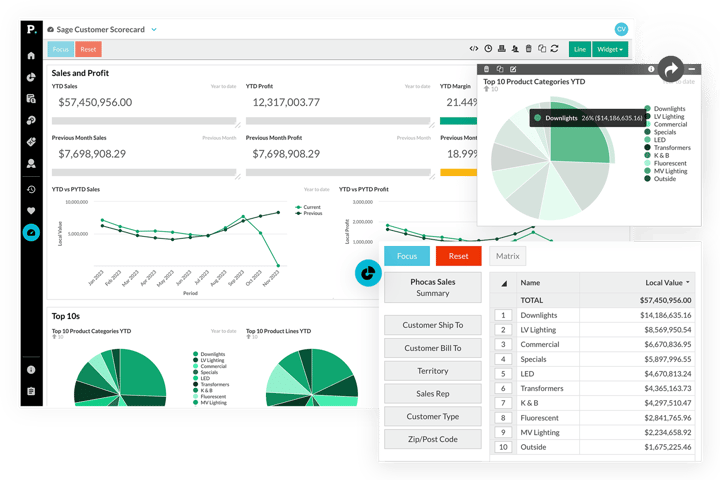
Accessible, accurate data empowers teams
- Sales teams can review their own income statement (P+L) and then analyze their revenue and expenses by a number of variables
- Unite your team with a single set of accurate numbers
- Provide branches or regional teams with permission-based access without affecting the general ledger
Before sales reps visit a customer, they can pull up their dashboard so they know what to pitch really quickly. It's easy to pull this information on Phocas rather than the ERP - it's a lot quicker.
— Jared Lombardi, Director of Finance at AAMP Global.
Scale with FP&A + BI together
- Phocas offers BI Analytics, Financial Statements, Budgets & Forecasts and Rebates products that integrate seamlessly with Sage ERP systems
- No need to purchase all platform products together, simply choose what you need now and add more when you need them.
Phocas powers thousands of data-driven companies worldwide


See how Phocas stacks up against the competition
Based on hundreds of customer reviews on BARC.
Anaplan 
vs
Phocas Software 
7.8
Reporting / analysis
10
9.1
Recommendation
8.6
N/A
Product satisfaction
8.5
10
Predictive planning
8.5
2.8
Predefined connectors
8.4
8.0
Performance satisfaction
8.4
5.4
Planning content
8.3
9.6
Project length
8.3
N/A
Ease of use
8.0
9.4
Innovation
7.7
4.2
Implementer support
7.6
5.2
Vendor support
7.4
6.8
Project success
7.2
N/A
Driver-based planning
6.8
Source: The Planning Survey 24, BARC
Vena 
vs
Phocas Software
6.2
Reporting / analysis
10
9.2
Recommendation
8.6
10
Product satisfaction
8.5
3.9
Predictive planning
8.5
1.0
Predefined connectors
8.4
5.8
Performance satisfaction
8.4
5.5
Planning content
8.3
10
Project length
8.3
8.0
Ease of use
8.0
6.5
Innovation
7.7
6.5
Implementer support
7.6
6.5
Vendor support
7.4
7.1
Project success
7.2
7.5
Driver-based planning
6.8
Source: The Planning Survey 24, BARC
Board 
vs
Phocas Software
9.5
Reporting / analysis
10
7.9
Recommendation
8.6
N/A
Product satisfaction
8.5
1.5
Predictive planning
8.5
8.0
Predefined connectors
8.4
5.0
Performance satisfaction
8.4
2.7
Planning content
8.3
1.3
Project length
8.3
9.1
Ease of use
8.0
3.6
Innovation
7.7
3.0
Implementer support
7.6
4.8
Vendor support
7.4
5.8
Project success
7.2
4.2
Driver-based planning
6.8
Source: The Planning Survey 24, BARC
Jedox 
vs
Phocas Software
6.4
Reporting / analysis
10
6.5
Recommendation
8.6
7.4
Product satisfaction
8.5
3.4
Predictive planning
8.5
8.2
Predefined connectors
8.4
3.9
Performance satisfaction
8.4
8.0
Planning content
8.3
3.8
Project length
8.3
6.9
Ease of use
8.0
4.6
Innovation
7.7
5.3
Implementer support
7.6
5.8
Vendor support
7.4
5.4
Project success
7.2
2.6
Driver-based planning
6.8
Source: The Planning Survey 24, BARC
Insight software IDL 
vs
Phocas Software
4.9
Reporting / analysis
10
3.2
Recommendation
8.6
2.9
Product satisfaction
8.5
3.6
Predictive planning
8.5
4.9
Predefined connectors
8.4
5.4
Performance satisfaction
8.4
5.5
Planning content
8.3
3.6
Project length
8.3
N/A
Ease of use
8.0
2.7
Innovation
7.7
1.0
Implementer support
7.6
2.2
Vendor support
7.4
5.8
Project success
7.2
3.4
Driver-based planning
6.8
Source: The Planning Survey 24, BARC
OneStream 
vs
Phocas Software
9.1
Reporting / analysis
10
10
Recommendation
8.6
N/A
Product satisfaction
8.5
7.5
Predictive planning
8.5
8.3
Predefined connectors
8.4
9.7
Performance satisfaction
8.4
9.7
Planning content
8.3
2.9
Project length
8.3
N/A
Ease of use
8.0
7.7
Innovation
7.7
5.4
Implementer support
7.6
6.4
Vendor support
7.4
5.5
Project success
7.2
N/A
Driver-based planning
6.8
Source: The Planning Survey 24, BARC
An award-winning Sage partner
Based on 270+ customer reviews


Understand the past, operate better today, and plan well for the future
Whether you want to get your data organized for your team or you’re looking to combine business intelligence capabilities with financial reporting, planning and analytics… We can guide you. Let’s see if we can help.