Fast, flexible Sage reporting for busy teams
Quick & obligation free


Made for Sage
Phocas has been seamlessly integrating with Sage for many years. We assess your needs up front to ensure Phocas is the right fit, paving the way for a fast return on investment. Our dedicated implementation team takes care of all the heavy lifting, achieving in a matter of weeks what can take other providers 1 -2 years (and beyond) to complete.
- Sage 50
- Sage 100 CRE
- Sage 200
- Sage 300 CRE
- Sage Intacct
- Sage X3

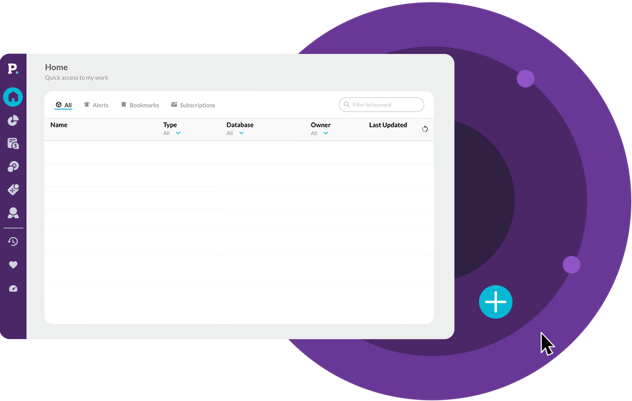
Self-serve Sage reports
- Self-serve: reports and dashboards can be built and customized in minutes; from scratch or using pre-built templates
- KPIs: report on metrics relevant to your department, save as favourites and set up ongoing alerts
- Granular visibility: drill down to transactional-level data by branch, division, sales rep, product, customer and gain instant answers
- Phocas AI: fast-track data analysis for new users
- Time & cost: self-serve reporting prevents a backlog of requests to IT and Finance, and avoids escalating consultant costs
Streamlined budgets & forecasts
- Flexible: with a familiar, spreadsheet-like interface, it's easy to make budgets more detailed – without manual errors and version control issues
- Automated: live data pulled from your Sage ERP feeds budgets and forecasts, so actuals are always reliable
- Collaboration: assign tasks, collect clear input with context and approve budgets faster – all in one place
- Consolidate: connect plans across the business in one place; financial budgets, sales forecasts, headcount and demand planning


Trusted by companies worldwide
The Phocas platform empowers over 3,000 businesses who make, move and sell products. 97% of customers stay with us year-on-year because our platform gives people confidence to run their businesses better.
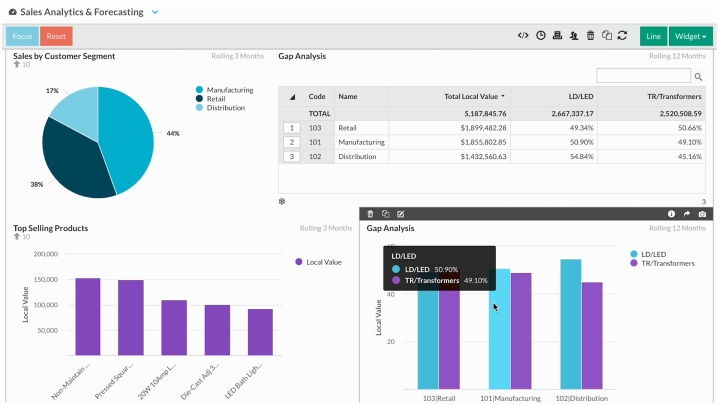
Smarter, self-serve reporting
- Fast: reports and dashboards can be built and customized with ease; from scratch or using pre-built templates
- Flexible: create, customize, automate profit & loss, balance sheet and cashflow statements for cross-functional teams in minutes
- KPIs: stay up to date on metrics relevant to your department, save as favourites and set up ongoing alerts
- Detailed visibility: drill down from dashboards, investigating by branch, division, sales rep, product, customer down to transaction detail to gain instant answers
- Customize: add visualizations; charts, graphs sparklines or calculations like revenue + gross profit per rep or days stock cover that auto update

Everyday tracking is so simple
The team at Bowens use Phocas every day. Why, because it's so simple to use and they're no longer relying on 'gut feel'. Everyone can quickly access up-to-date sales data, break it down and identify opportunities and areas for improvement.

Fast, accurate data
- Automated: data is pulled from your NetSuite ERP, multiple subsidiaries, countries, warehouses, or even multiple ERPs into one source of truth
- Reliable: Phocas handles big data volumes while maintaining fast, reliable performance
- Secure: data is accessible to everyone who needs it, while finance maintains employee-level security to protect sensitive information
- Migration: quick to implement, providing uninterrupted dataflow, reporting, dashboards even during ERP migrations
- AI-assisted: fast-track data analysis for new users by asking questions like; ‘Which customers declined last quarter?’
Smooth ERP migration, uninterrupted reporting
- BI-driven: one of Phocas’ specialties is connecting data, making it an ideal BI-based solution for ERP migrations
- Fast: can be quickly implemented to provide uninterrupted reporting, dataflow, dashboards before, during and after migrations
- Secure: Phocas provides secure data warehousing for your historical data, pulling everything together into one platform
- Effortless: Phocas does all the heavy migration lifting, so your teams can jump straight into self-serve reporting and analysis

See how Phocas stacks up against the competition
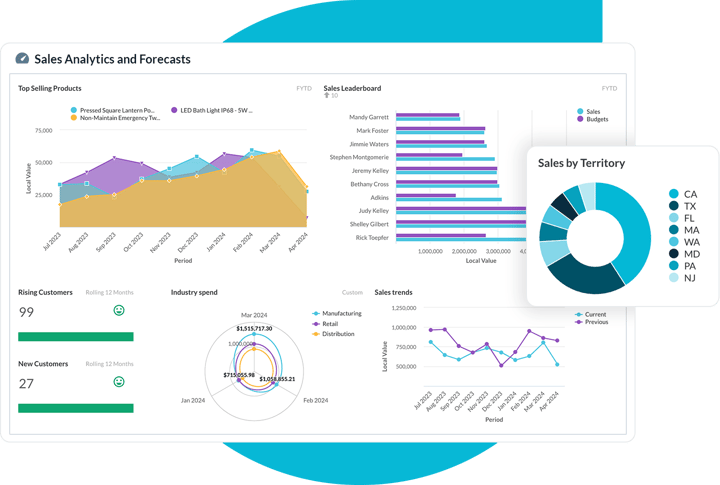
Visually presentable insights
- Unlimited: build, customize and share unlimited dashboards and workflows, creating a clear business overview
- Connect: visualize financial ratios and KPIs side-by-side, connecting different divisions, subsidiaries, branches to performance
- Drill down: quickly switch from visualizations to underlaying data where you can slice and dice the metrics
- Digestible: present live data insights to non-financial teams with graphs, pie charts, and Sparklines
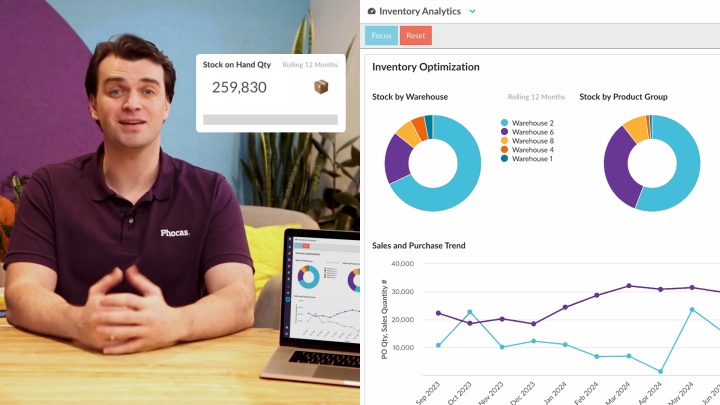
Seamless inventory analysis
- Manage stock: ensure optimal inventory levels with a clear, up-to-date view of stock movement and self-serve reporting
- Forecast: compare live actuals to historical data and budgets to accurately forecast demand; which products need to be replenished, liquidated or relocated
- Trend analysis: quickly combine purchase history, sales forecasts, seasonal and market trends to accurately predict stock requirements months ahead
- Maximize profitability: accessible, up-to-date data empowers purchasing and inventory teams to optimize pricing and improve supply chain planning
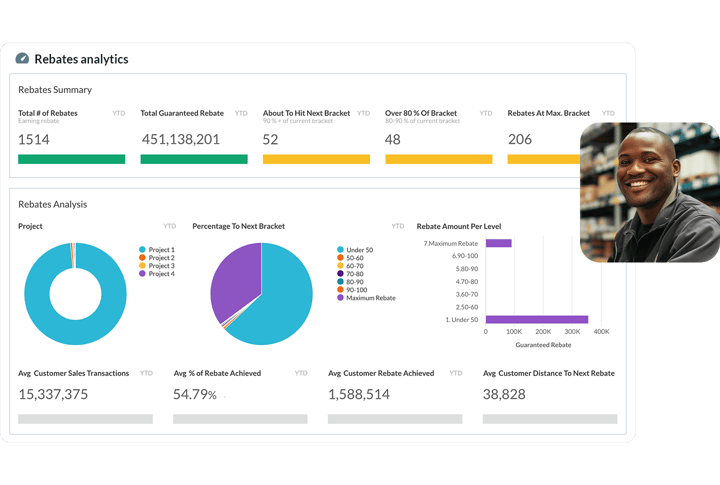
Boost rebates profitability
- Automated: stay on top of payable and receivable rebates with a self-serve tool that speeds up rebate management
- Accurate: prevent overpayments or under claiming rebates with real-time data and automated calculations
- Improved analysis: review rebate programs including structure – are they driving sales, and view impact on profit and margin in one place
- Win-win partnerships: track customer target accruals, use near-miss analysis, explore ‘what if’ scenarios and showcase potential earnings in person
Accurately forecast demand
- Detailed: analyze patterns for different market segments such as customer demand by product class, geography, sales channel, purchase history
- Reforecast: easy access to live actuals empowers teams to adjust forecasts to align with changing inventory needs
- Seasonal: tap into historical data and analyze your seasonal sales trends to create more accurate inventory forecasts
- Review: easily review your forecast accuracy by comparing it to actuals

Simplify work with a single source of truth


We think you’ll love Phocas, but don’t take our word for it


Understand the past, operate better today, and plan well for the future
