Analyze every part of your business

Connect your data and your people with Phocas
One trusted source of data truth
- A cloud-based solution that integrates with Epicor and 200+ other data sources - not limited to specific ERPs, MRPs, finance systems or CRMs
- Consolidate financial and operational information and empower your whole business to be more data-driven
- Enjoy an efficient integration process customized to your business needs, with support every step of the way

Customer quote
Move from summaries to underlying details
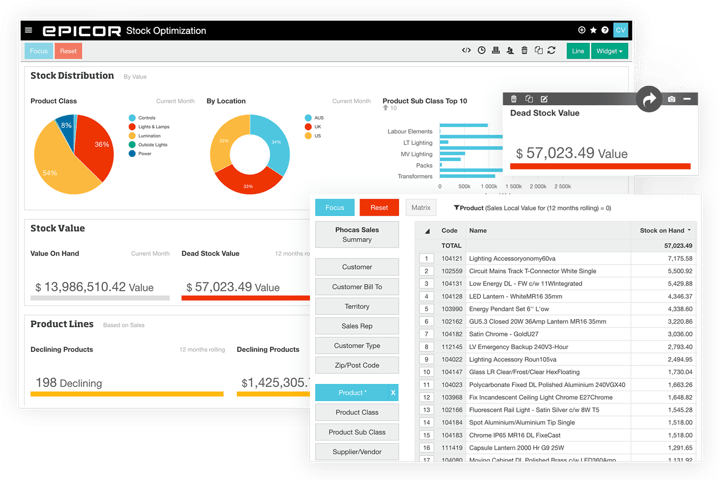
- Interactive dashboards incorporating real-time data provide you with the full picture at a glance
- Graphs, charts and graphics allow you to share business insights in a simplified format, improving individual and team engagement
-
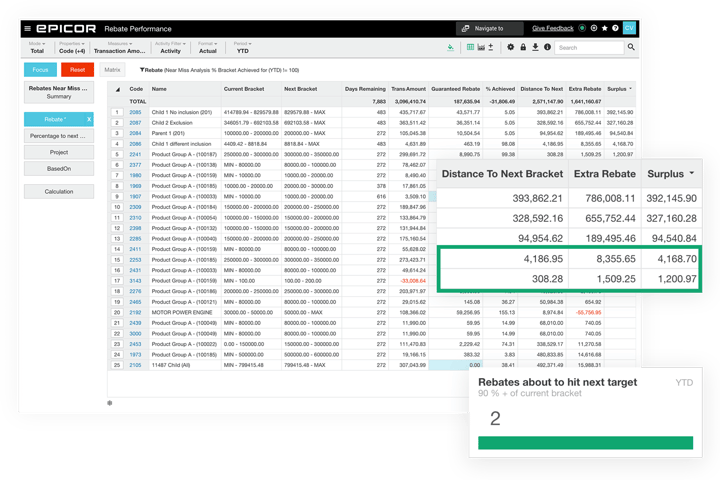
Quickly jump from data visualizations into the underlying data, slice and dice the metrics to answer your question

Customer quote
Real-time data exploration
- Phocas' unique Grid is an ad-hoc analysis layer that allows free-form analysis
- Drill down from high-level dashboards to cost centre, GL code and transactional-level data for the ordered detail
- Easy-to-understand dashboards improve analysis engagement of non-financial people
-
Predictive analytics is enhanced by the ability to easily identify and track trends and share insights

Customer quote
Intuitively simple for both power user and tech novice
- Hit the ground running with built-in dashboards, customizable reports and ongoing support from real humans
- Simple for administrators to bring in new data sources and configure EDA to suit your business needs - all with drag and drop functionality
- Reduce costs without the need for ongoing expert help

EDA benefits
Ad-hoc analysis
Visualizations
Dashboards
Collaboration
Reporting
Technology
All-in-one platform
The EDA Suite integrates directly with your Epicor ERP and provides you with a single platform for business intelligence and financial planning that your whole business can use.
Each product within The Suite works harmoniously together, helping you carry out deeper analysis and data-driven planning with confidence.

Frequently asked questions
Business Intelligence (BI) software is designed to retrieve, analyze, transform, and report on business data and metrics. BI software provides organizations with an integrated view of their core business by combining data from multiple data sets, such as enterprise resource planning (ERP) systems, CRM databases and e-commerce. BI can also be used to identify trends, uncover insights, and make informed business decisions.
1. Improved Decision-Making: Dig into the data, analytics and insights to make clear decisions. Consolidated data helps to reduce the risk of making decisions based on guesswork or limited information.
2. Increased Efficiency: automate data preparation and data analysis tasks that would otherwise require manual effort. Easily set up new connectors and data integrations to other business systems and databases
3. Reduced Cost: Business intelligence tools often provide a more cost effective way of gathering and analyzing data than traditional methods, such as manually loading data to Excel spreadsheets by numerous people.
4. Enhanced Customer Service: Discover the data and insights needed to better understand customer needs and preferences. This helps to improve customer service and satisfaction.
5. Increased Revenue: Business intelligence software helps to identify opportunities for new products and services, and to optimize pricing and promotions to maximize revenue.
The main difference between Business Intelligence (BI) and Business Analytics (BA) is their focus on when events occur. BI concentrates on current and past events that are documented in business data and systems, while BA focuses on predicting likely outcomes in the future - predictive analytics. In other words, BI answers the question "What is happening now and why?", while BA answers "What will probably happen next?".
BI helps companies create strategies for present scenarios by transforming data into actionable insights.
BA, on the other hand, uses predictive analytics to create strategies that will shape future operations, aiming to improve productivity and existing systems.
BI software is often restricted to data analysts who are experienced in writing SQL and reporting queries. Phocas is a self-service BI solution that is specifically designed for both power users and non-technical users. This ease-of-use increases user adoption across your business and encourages everyone to become more data-driven. Phocas interfaces are similar to Excel spreadsheets as well as allow for train-of-thought data mining and data discovery.
Every business needs some level of business data analysis and the capacity to plan for future growth and change. Consolidating multiple data sets is a complex process and manually generating reports using Excel Spreadsheets is time-consuming and error prone. Performing these tasks without BI software, often requires help from a power user or your IT team, meaning your data is being managed and understood by only a few people. This can leave you feeling like you’re making business decisions based on incomplete data, or that your reporting process is very inefficient and it can inhibit regular data analysis and accurate forecasting.
If any of this sounds like you, Phocas BI software could be the solution you're looking for.
There are a lot of BI platforms to choose from. Here are some key points to consider:
- Ask how well the software connects with your ERP and other data sources.
- Ask for a demo or trial - if that addresses some of your problems, ask for a live demo using your company data.
- Determine what the implementation process looks like, what support and training is provided and how long will this process takes?
- Do you need a data expert for data preparation and to build reports and dashboards.
- Will you need ongoing expert help for customization of reports or to interpret complex data.
- How many end users need to access the software?
- Is the software easy for non-technical people to use?
Understand the past, operate better today, and plan well for the future
