Phocas Academy

Learning modules
View all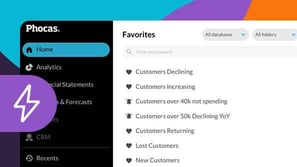
Phocas Analytics QuickStart
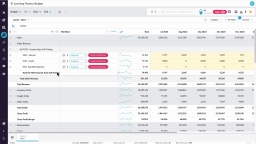
Financial Statements QuickStart
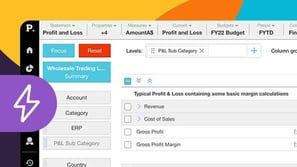
This module for beginners helps you get started in Phocas Financial Statements. Learn about the grid, layouts and charts and how to add a favorite view to your dashboard.
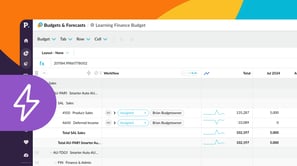
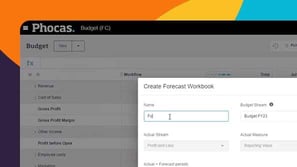
Budgets & Forecasts QuickStart
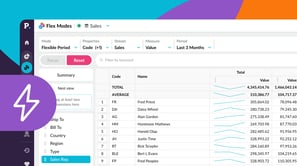
Flex Modes QuickStart
This beginner-friendly module walks you through getting started in Flex Modes and shows you how to run simple analyses for quick insights. Learn how to explore your data with Flex Modes and see how the different modes and features give you the flexibility to view, compare, and analyze your information in ways that work best for you.
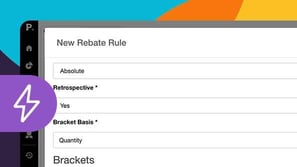
Rebates QuickStart
A simple way to re-forecast
Video tutorials
View all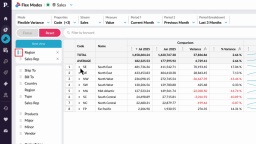
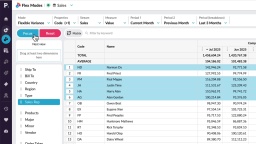
Create a nested view
With the nest view feature in Flex Modes, you can add dimensions as levels in the grid, making your data easier to interpret. This lets you see how different items contribute to the overall results and build reports where you define the hierarchy of the data on display.
Take a tour of Flex Modes
Learn how to explore your data with Flex Modes, and see how the different modes and features give you greater flexibility in how you view, compare, and analyze your information.
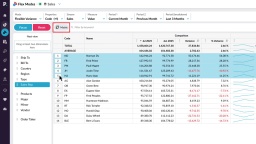
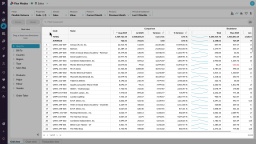
Compare data in a matrix
Learn how to filter and pivot rows at the same time, letting you view two dimensions side by side in a matrix. This makes it easy to compare your data and quickly spot any differences.
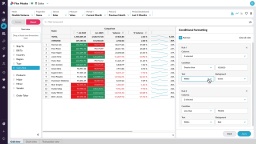
Apply conditional formatting
Filter data in Flex Modes
 Help & support