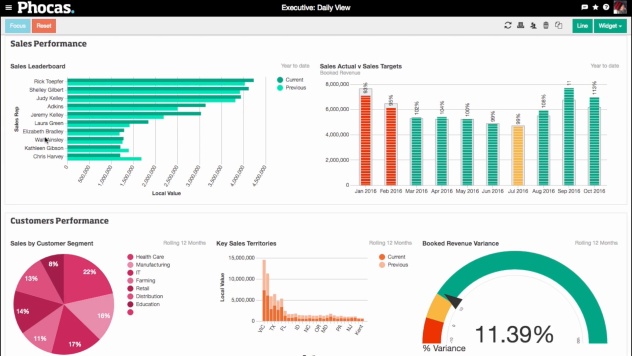
Quick, easy access to all your business data
What really sets Phocas apart is the unique ad-hoc analysis layer, The Grid. Incorporating a familiar format to Excel spreadsheets, The Grid makes it simple for all business users to access financial and non-financial data while also empowering people to perform in-depth analysis.
It all starts with robust BI
Phocas' robust BI foundation consolidates business data from your ERP, CRM, and AP/AR systems and multiple other data sources. This provides one trusted source of data truth.
With an easy-to-access consolidated view of financial, sales and operational data, in-depth analysis and ad-hoc reporting can become an everyday occurrence for all business users - not just the data analysts.

Lightening fast access to all your data
Phocas has the ability to ingest and comprehend massive amounts of business data, meaning it provides lightening fast data access and loading times.
With just a couple of clicks in the Grid you can analyze sales, finance, HR and operational data in real-time, enabling you to find on-the-spot answers to specific business questions.

Answer your own questions
The Grid ad-hoc analysis layer is so user-friendly it empowers everyone to drill down into data from high-level summaries to transactional-level data.
Better still, business users can pivot the data so it can be viewed in multiple ways, such as by customer, branch, product or region.
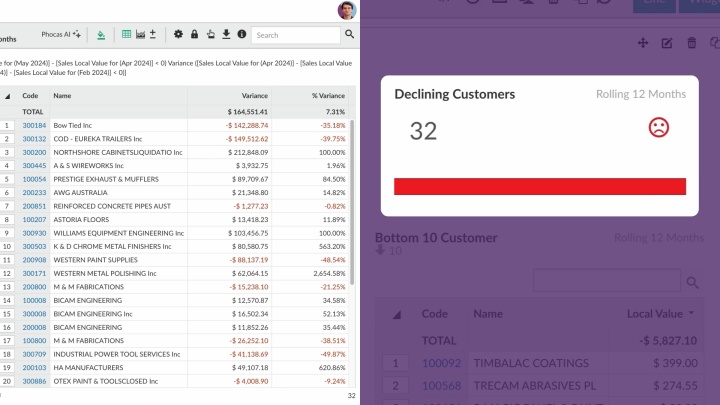
Present your insights to the wider business
The Grid enables you to quickly change from a tabular view to a visual overview using tools like dashboards, charts and graphs. Showcasing your metrics in a clear and impactful way.
Presenting insights visually helps to simply complex data by providing stakeholders with an at-a-glance view of business performance. Improving overall understanding and facilitating more informed decision-making.
Analytics in action: Take a video tour
-
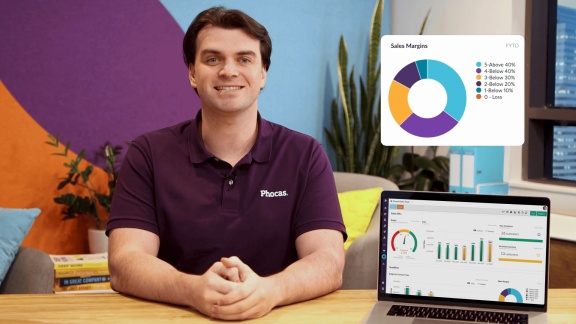 Quick and easy access to dataLearn how you can get quick and easy access to the information you need to make data-driven decisions with trusted data that’s pulled fresh from your ERP.
 -
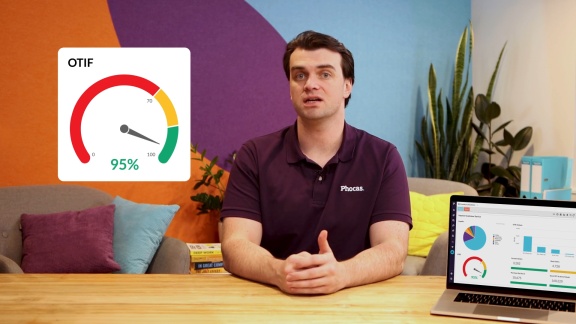 Self-serve reports and alertsBreak-free of the cycle of back-and-forth report requests and revisions with IT. Take a look at how easy it is to set up reports and alerts in Phocas.
 -
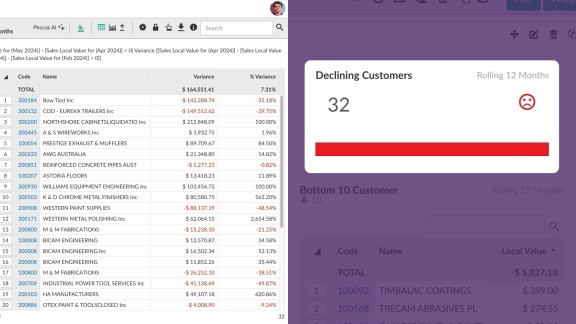 Drill down and follow your train of thoughtLearn how Phocas lets you drill into your data to get super-fast answers and understand what is happening and why.
 -
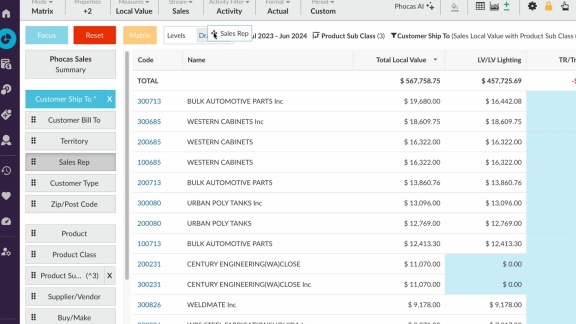 Identify opportunities to grow salesSee how Phocas can grow sales by helping your reps quickly identify easy wins, such as cross-sell opportunities in a few clicks.
 -
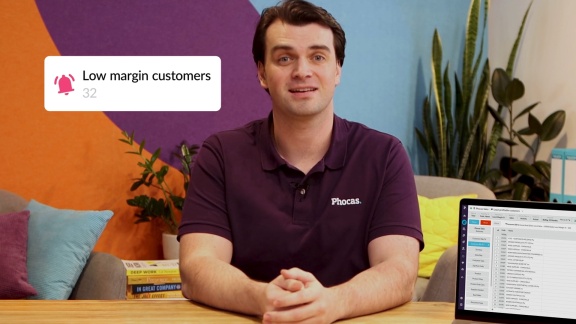 Track profitability of salesWith Phocas you can easily track the actual margins you’re making and identify customers who may be less profitable than they first appear.
 -
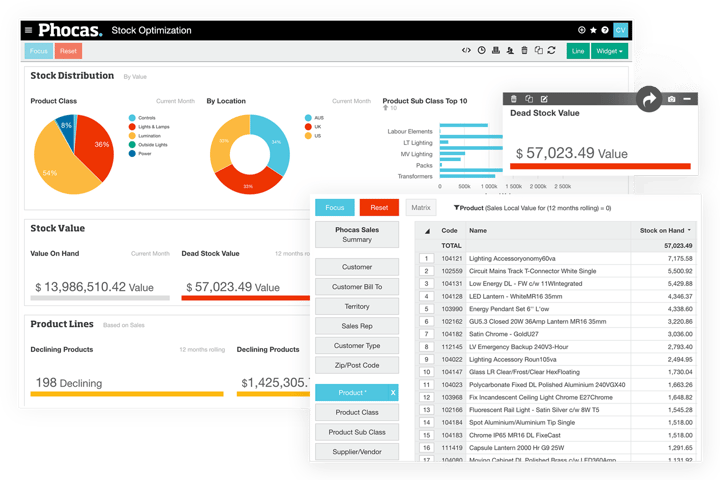
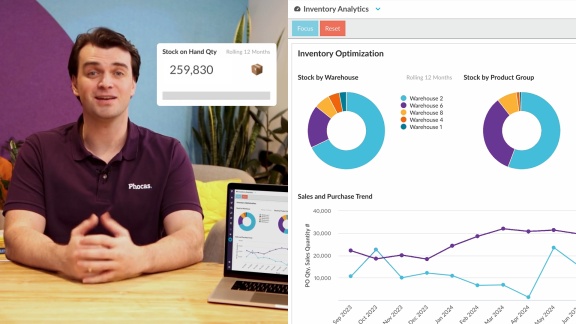 Optimize stockForget managing stock using your ERP or spreadsheets – see how Phocas makes it super easy to stay on top of your inventory.
 -
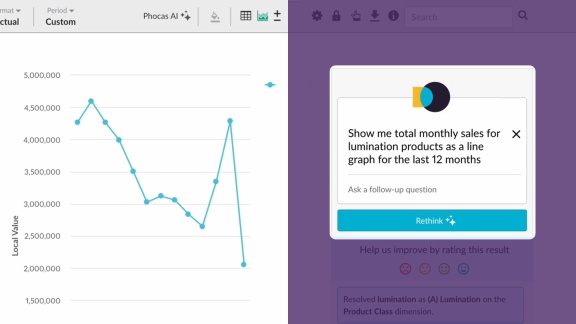 Phocas AIDiscover how Phocas AI helps you uncover insights quickly helping you drive impact across your business.
Unbreakable
Save time
See it all
Frequently asked questions
Ad hoc analysis refers to the process of conducting on-the-fly and impromptu data exploration and investigation to answer specific questions or to gain insights into a particular issue or dataset. Unlike predefined and structured analyses, ad hoc analysis is typically unscripted and flexible, allowing people to follow their train of thought. It is commonly used in Analytics enabling business people to uncover unexpected patterns, anomalies, or trends in data from finance to sales. In Phocas Analytics, ad hoc analysis will soon be available via Phocas AI where a person types a prompt to a database and the natural language processing supplies an answer.
Ad-hoc reporting and analysis are critical components of modern business intelligence (BI) solutions, allowing business users to create their own reports, graphs, and dashboards on an as-needed basis.
This self-service reporting approach empowers end-users to access specific data sets from various data sources, offering real-time insights for data-driven decisions. With ad-hoc reporting tools, such as drag-and-drop visualization and SQL capabilities, stakeholders can easily explore metrics, KPIs, and answer specific business questions without relying on IT departments.
The benefits of ad-hoc reporting include optimizing decision-making, saving time, and tailoring reports to meet specific business needs, all in a user-friendly and on-demand manner. Unlike traditional canned reports or static templates, ad-hoc reporting enables everyone to drill-down into specific data, helping businesses improve profitability and data governance.
Report-ready data: A self-serve BI solution will consolidate your ERP and other business data into one one source of truth. The data should already be cleaned, transformed and structured ready for report building.
Create a new report: BI software that is genuinely self-serve will provide pre-built assets or templates that enable you to quickly create a new report, worksheet or project rather than starting with a blank canvas.
Select data elements: Choose the specific data elements you want to include in your ad hoc report. This could involve selecting tables, fields, and dimensions to build your report.
Apply Filters and Parameters: You can add filters and parameters to allow for interactivity. This lets users customize the data they see in real-time, making the report truly ad hoc.
Define Calculations and Aggregations: Depending on your reporting needs, you might need to perform calculations or aggregations on the data. Self-serve BI tools usually provide features for creating custom calculations.
Add Visualizations: Incorporate dashboards, charts, graphs, and other visual tools to present the data in an at-a-glance format that is easy for everyone to understand.
Save and Share: Once you've created the ad hoc report, save it or add it to your favorites. Most self-serve tools allow you to share your reports with colleagues or stakeholders through various means, such as exporting to PDF, sharing a link, or embedding in a webpage.
Collaboration and accountability: End-users can interact with the report, applying filters, selecting different dimensions, and customizing the view to suit their specific needs. You may also have the ability to assign users to tasks which are logged and tracked. The end user can then respond and explain the rationale behind specific data, providing you with a complete audit trail.
Scheduled Refreshes: To keep your ad hoc report up to date, ongoing data refreshes should be set up (often customized to your business needs) to ensure that all data remains current.
Security and Access Control: Self-serve BI tools usually provide user-based access control and authentication mechanisms. This type of layered permission control ensures end-users can only access and edit what they are permitted to.
Understand the past, operate better today, and plan well for the future

