Understand performance at every level of your business
Empower all your people to see and understand financial performance relevant to their decision making.

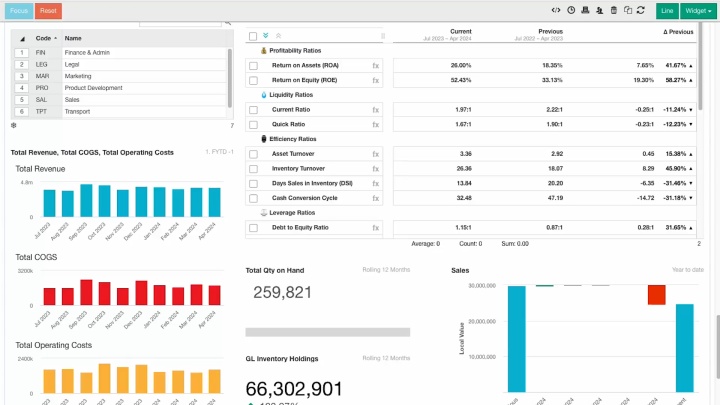
Go deep into your financial performance
With Phocas Budgets & Forecasts and Financial Statements you integrate your data, planning and reporting across your organization so results are easily monitored.
- Compare live actual performance against planned budget figures and make timely adjustments
- Review financial KPIs over time with easy access to current and historical financial statements
- See side by side snapshots of current financial performance for all branches, regions and products
- Drill down into transactional source data for performance variances.

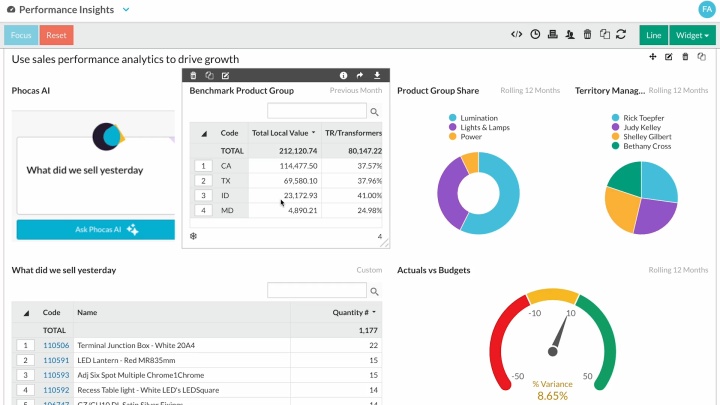
Use sales performance analytics to drive growth
What did we sell today, what didn’t we sell today? Slice and dice your data by sales rep, product or region in a few clicks or use natural language queries with Phocas AI.
- Share insights and benchmark across branches
- Check sales actuals against budget to monitor performance
- Nurture a data-driven culture across your sales team.
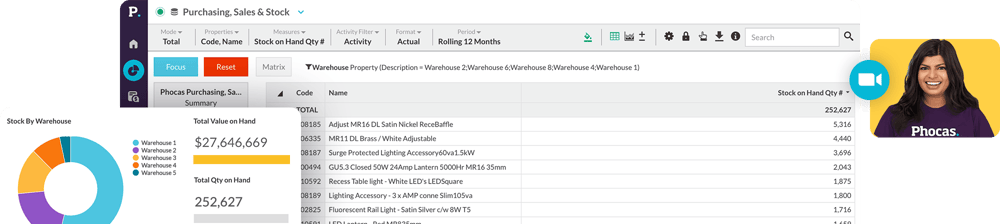
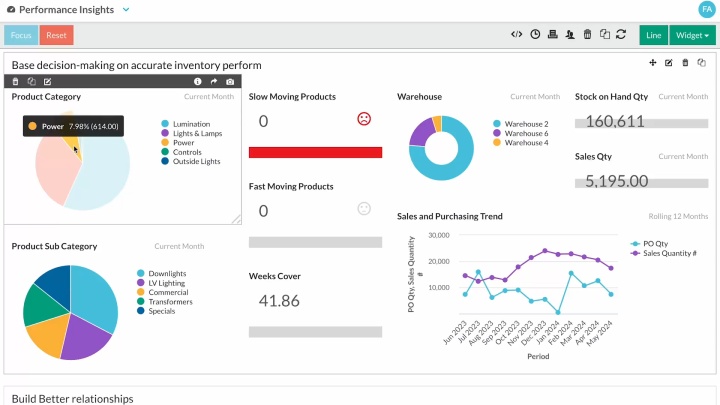
Base decision-making on accurate inventory performance analysis
Use stock and sales figures to monitor your inventory in Phocas so you know where to allocate your resources. Improve cash flow, reduce dead stock and make every aspect of your operations more efficient.
- Get a clear view on inventory performance by tracking key metrics
- Identify fast and slow moving inventory across category & sub-category
- Calculate your stock coverage in days to compare against lead times
- Share inventory dashboards for a high-level view of what’s happening.
Build better relationships using supplier performance metrics
Maintain an efficient supply chain by calculating supplier performance metrics with Phocas Analytics. Transparency of the performance numbers keeps suppliers in check.
- Use analysis to negotiate better terms and compare suppliers
- Measure DIFOT and determine if suppliers are delivering late or not in full
- Use data insights to help suppliers understand your needs and expectations.

Let people visualize and own their performance
More visibility of financial performance through dashboards means better conversations between teams and accountability of people’s individual performance.
- See what you need with security and permission controls
- Self-serve reporting tools are easy to use
- At-a-glance sparklines represent all your finance information
- Chart performance with one click and view the big picture.

Demand planning boasts profitability


Our data in Phocas, combined with our retail partners' sales data lets us plan inventory to place the right commitments with our resources and vendors overseas. This allows us to make sure we're holding the right number of weeks' stock domestically to meet demand. It ensures that we are running a profitable business.
— Harvey Lewis, General Manager at Caprice.
Customize performance dashboards to suit your business
Unlimited dashboards in Phocas get more people in your organization visualizing financial, sales and operational performance. Sharing charts or graphs this way communicates insights and drives data-based decisions.
- Build financial statement dashboards to demonstrate the performance of your strategy
- Allow stakeholders to review overall performance or filter to one division via dashboards
- Phocas dashboards help more people understand the numbers which leads to a stronger performing business.
Everyone can access the performance analytics they need
Customize dashboards
Get performance metrics specific to your business or job role. Whether it's a high level view or how each of your branches are tracking, see it all on a Phocas dashboard.
DIY data exploration
Feel good about data
When your business is in Phocas, you’re all on the same page so people can do more. Your people feel good because they have time to focus on the work they want to do.
Human-friendly tech loved by all departments
At Phocas, we believe in delivering a great user experience. Because when software makes your job easier, it becomes invaluable. That's a win for you and us, and there's nothing we love more than a confident customer who is seeing real-world growth in their partnership with us.

Understand the past, operate better today, and plan well for the future